Vol. 12, No. 12 / Is The U.S. Mussel Aquaculture Industry Growing?
Filed Under:
December 14, 2022
Abstract
- This presentation shows overall U.S. mussel aquaculture production trends and farmgate values.
- U.S. aquaculture data are available from 1983 to 2019.
- Values beyond 2019 are predicted using econometric models developed by Dr. Posadas.
- Annual production is expected to rise during the next decade.
- Recessions disrupted domestic production and markets of farmed mussels.
- Annual farmgate values are projected to rise during the next decade.
Suggested Citation:
Posadas, Benedict C. 2022. Is the U.S. Mussel Aquaculture Industry Growing? Mississippi MarketMaker Newsletter, Vol. 12, No. 12. December 14, 2022.
Acknowledgment
This virtual presentation is a contribution of the Mississippi Agricultural and Forestry Experiment Station and the Mississippi State University Extension Service. This material is based upon work that is supported in part by the National Institute of Food and Agriculture, U.S. Department of Agriculture, Hatch project under accession number 081730 and NOAA (Office of Sea Grant, U.S. Dept. of Commerce, under Grant NA10OAR4170078, Mississippi Alabama Sea Grant Consortium).
U.S. Mussel Farms
- More than 30 farms are growing blue mussels in the U.S. (2018 Census of Aquaculture).
- Mussels are farmed mainly in Washington, California, Maine, and Rhode Island. Blue mussels are economically and environmentally important filter-feeding bivalves.
Blue Mussels
- They are commonly harvested for food worldwide from wild and farmed sources.
- Range from 2 to 4 inches at maturity, though it can grow up to 8 inches.
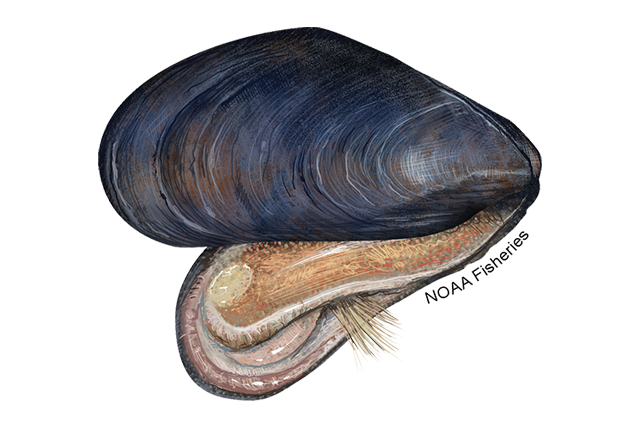
- The shell is black, blue-black, or brown, tear-drop shaped, and has concentric lines marking the outside; the inner shell is white.
- The ‘beard’ is the byssal threads allowing the mussel to attach to the substrate.
- Are of the shellfish family. Like oysters, clams, and scallops, they are bivalve mollusks and have a hinged shells.
- Adults are sessile—they stay in one place—and inhabit both intertidal and subtidal areas.
- Have fast growth rates and high reproduction rates.
- First mature as males, then later develop female reproductive capabilities.
- Each female can produce between 50 and 200 million eggs during spawning.
Let Us Start Our Modeling Effort!
- The Food and Agriculture Organization (FAO) data on national aquaculture production are reported in tons and converted into pounds per year.
- The FAO data on national aquaculture farmgate values are reported in dollars per year.
- Farmgate prices are imputed from the farmgate values and pounds of live weight.
- U.S. aquaculture data are available from 1984 to 2019.
- Values beyond 2019 are predicted using econometric models developed by Dr. Posadas.
U.S. Aquaculture Economic Models
- The Ordinary Least Squares (OLS) models of U.S. aquaculture consisted of the following dependent variables:
- Aquaculture production (lb/yr)
- Deflated farmgate value ($/yr)
- The OLS models of U.S. aquaculture were estimated using the robust variance procedure of STATA-16.
- The variation inflation factor was calculated to detect the possible presence of multicollinearity.
- The marginal impacts of disaster events were computed using the margins procedure.
U.S Aquaculture Production Economic Model
- The OLS model of U.S aquaculture production (lb/yr) assumed that annual production could be explained by the following:
- year and year-squared
- recession (1 or 0) and trade war (1 or 0)
- growth in per capita disposable income (%)
- other variables
U.S Aquaculture Farmgate Value Economic Model
- The OLS model of U.S. aquaculture farmgate value ($/yr) assumed that annual production could be explained by the following:
- year and year-squared
- recession (1 or 0) and trade war (1 or 0)
- aquaculture production (lb/yr)
- growth in per capita disposable income (%)
- other variables
U.S. Mussel Aquaculture, 2010-19
- Production (lb/yr)
- Farm-gate values ($/yr)
- Imputed farmgate prices ($/lb)
- Data were compiled from the Food and Agriculture Organization (FAO) website.
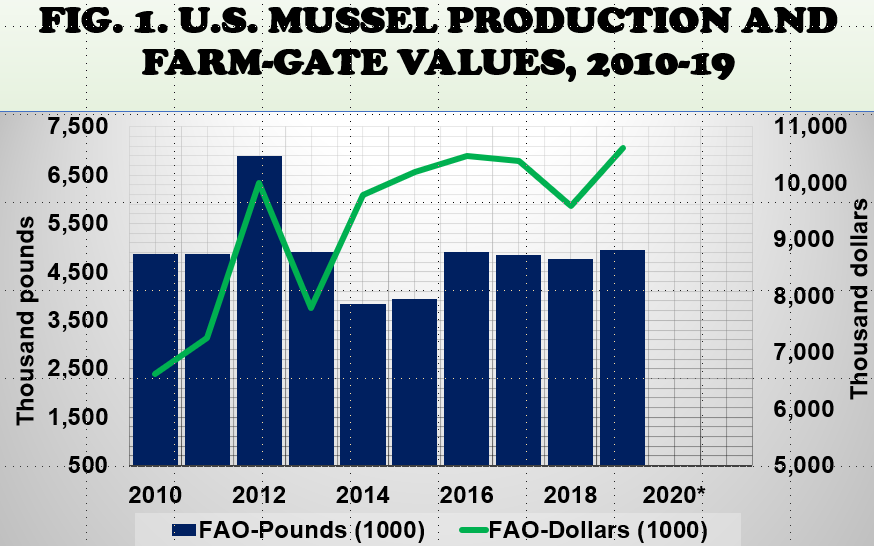
U.S. Mussel Production And Farmgate Values, 2010-19
- FAO-Pounds (1000) is the annual blue mussel production in pounds, as reported by FAO.
- FAO-Dollars (1000) is the annual blue mussel farmgate values in dollars, as reported by FAO.
- Annual production since 2014 averaged 4.5 million pounds (Fig. 1).
- Annual farmgate value since 2014 averaged $10.1 million.
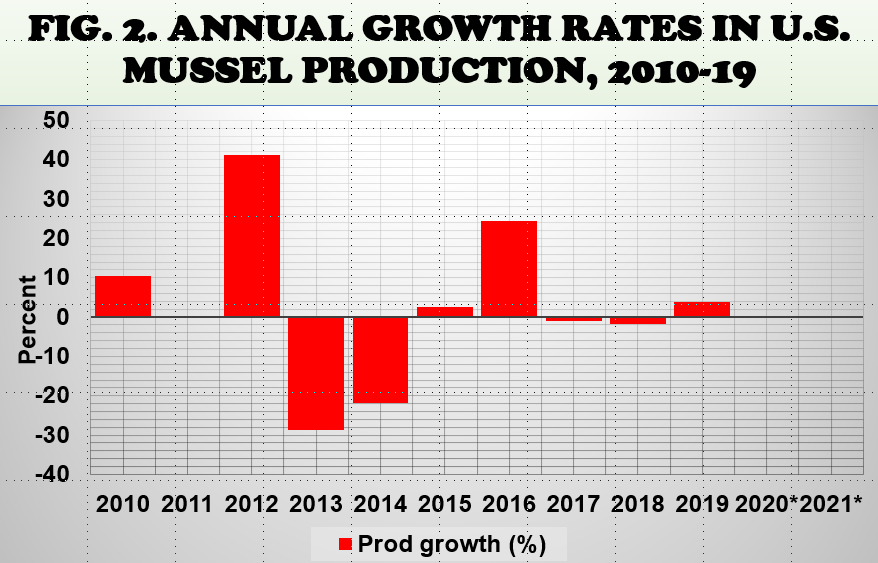
Annual Growth Rates In U.S. Mussel Production, 2010-19
- Production growth is the annual growth rate in blue mussel production in percent.
- The annual production growth rate since 2014 averaged 1.08 percent (Fig. 2).
- The annual deflated farmgate value growth rate since 2014 averaged 4.17 percent.
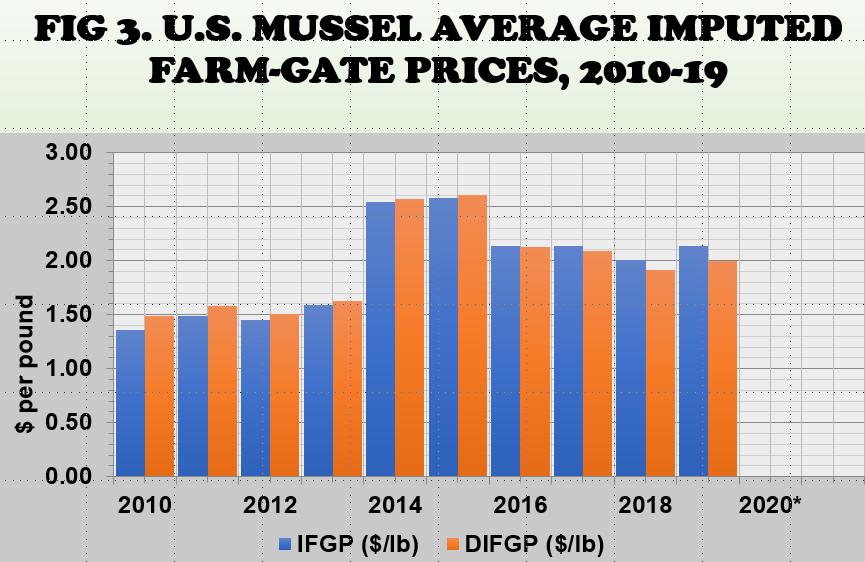
U.S. Mussel Average Farmgate Prices, 2010-19
- Urner Barry Comtell reports wholesale mussel prices in dollars per pound.
- The imputed farmgate price (IFGP) is expressed in dollars per pound.
- The deflated imputed farmgate price (DIFGP) is IFGP divided by the consumer price index.
- The imputed farmgate price (IFGP) since 2014 averaged $2.26 per pound (Fig. 3).
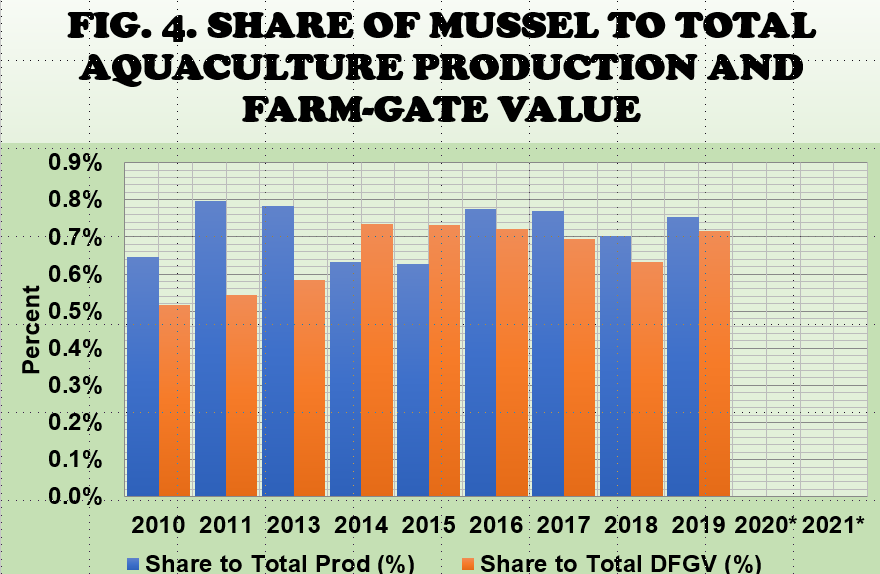
Share Of Mussel To Total Aquaculture Production And Farmgate Value
- Share to total is the percent contribution of mussel production or farmgate value to total U.S. aquaculture production or farmgate value.
- Share to total U.S. aquaculture production of mussel production since 2014 averaged 0.71 percent (Fig. 4).
- Share to total U.S. farmgate value of mussel aquaculture since 2014 averaged 0.70 percent.
U.S. Mussel Aquaculture, 1983 To 2021
- Production (lb/yr)
- Farm-gate values ($/yr)
- Imputed farmgate prices ($/lb)
- Data from 1984 to 2019 were compiled from the FAO Aquaculture website.
- Values from 2020 to 2021 were predicted using econometric models developed by Dr. Posadas.
U.S. Mussel Aquaculture Production Beyond 2019
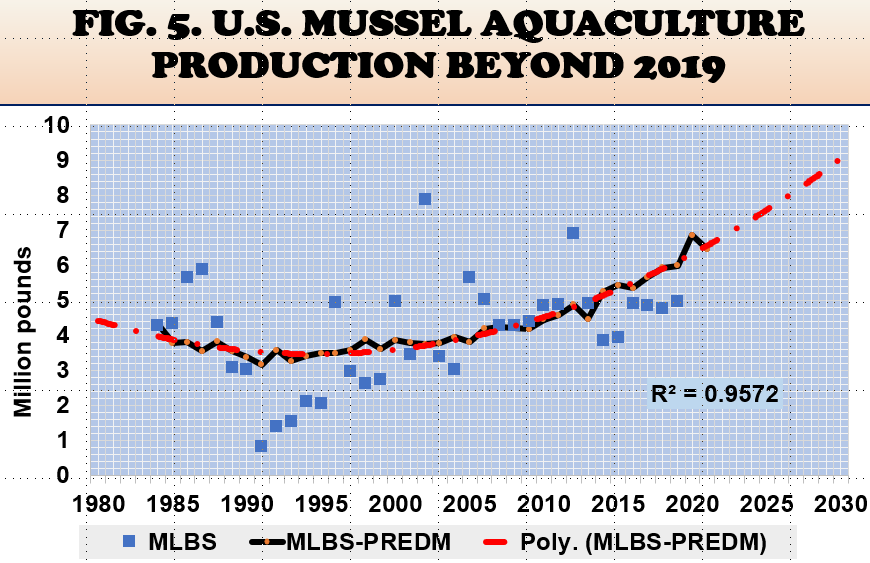
- The estimated OLS equation of aquaculture production explained 19 percent of the variations in annual production.
- Time is not a significant determinant of annual production.
- Recession is not a significant determinant of annual production.
- The per capita disposable income growth is a positive but insignificant determinant of annual production.
Estimating Long-Term Aquaculture Production From 2020 To 2030
- Fig. 5 shows the three time-series data on annual production.
- The blue dots show the actual FAO data on annual production up to 2019.
- The black curve portrays the OLS-estimated annual production up to 2021.
- The red-dotted curve represents the Excel-generated polynomial trend for annual production up to 2030.
- Overall, annual production is expected to rise during the next decade.
U.S. Mussel Aquaculture Deflated Farmgate Values Beyond 2019
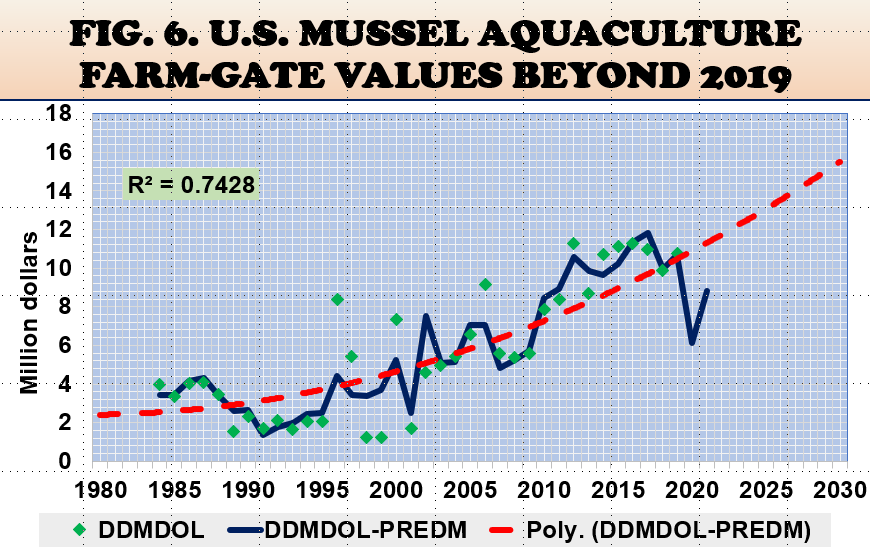
- The estimated OLS equation of clam aquaculture production explained 86 percent of the variations in annual farmgate values.
- Time is a significant determinant of annual farmgate values.
- Recession is a negative and significant determinant of annual farmgate values.
- The trade war is a negative and significant determinant of annual farmgate values.
- Annual production is a positive and significant determinant of farmgate yearly values.
Estimating Long-Term Aquaculture Deflated Farmgate Values From 2020 To 2030
- Fig. 6 shows the three time-series data on annual farmgate values.
- The green dots show the actual FAO data on annual farmgate values up to 2019.
- The black curve portrays the OLS-estimated annual farmgate values up to 2021.
- The red-dotted curve represents the Excel-generated polynomial trend for annual farmgate values up to 2030.
- Overall, annual farmgate values are expected to rise during the next decade.
Marginal Impacts Of Recessions
- Recessions caused the deflated farmgate values to decline from $0.98 to $3.17 million per year.
- Trade wars caused the deflated farmgate values to decline from $0.83 to $3.92 million per year.
- A million-pound expansion in annual production would raise the farmgate value from $0.11 to $1.11 million per year.
U.S. Mussel Imputed Prices Since 2014
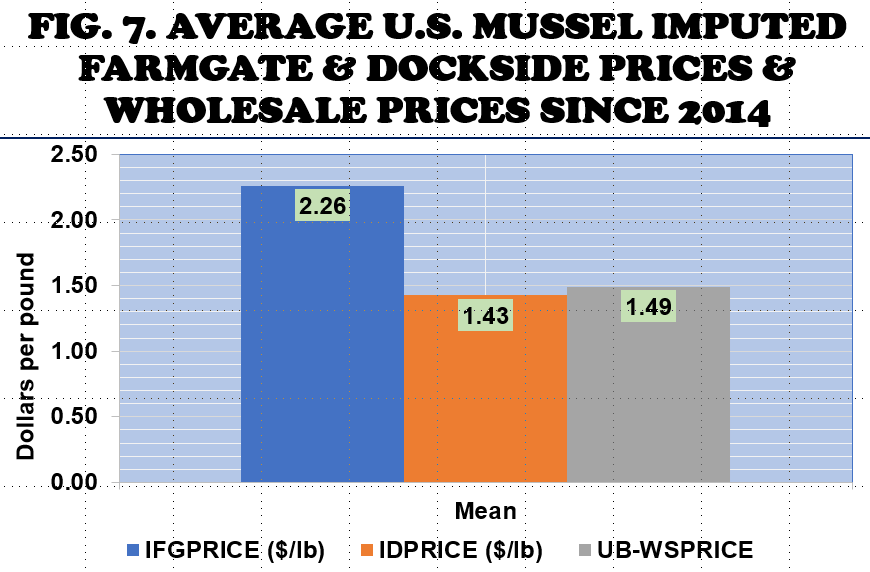
- Fig. 7 shows three average prices of mussels in the U.S. at the dockside, farmgate and wholesale markets.
- The blue bar shows imputed farmgate prices (IFGPRICE) using the FAO data, averaging $2.26 per pound.
- The orange bar portrays imputed dockside prices (IDPRICE) using the actual NOAA data, averaging $1.43 per pound.
- The grey bar represents the wholesale price (UB-WSPRICE) provided by Urner Barry Comtell, averaging $1.49 per pound.
- Overall, imputed farmgate prices are higher than imputed dockside prices and wholesale prices.
Summary And Implications
- Annual production is anticipated to rise during the next decade.
- Recessions disrupted domestic production and markets of farmed mussels.
- Annual farmgate values are projected to rise during the next decade.