Vol. 14, No. 6 / U.S. Market Potential for Red Drum Aquaculture
ABSTRACT
This newsletter summarizes the red drum's long-term commercial and recreational landings, dockside values in the United States and major producing states, aquaculture production, and farmgate values. It attempts to develop an approach to assessing the market potential of red drum for aquaculture. The major determinants of commercial landings, aquaculture production, and dockside and farmgate values are identified.
KEYWORDS
Market potential, Red Drum, Marine aquaculture.
ACKNOWLEDGEMENT
This newsletter is a contribution of the Mississippi Agricultural and Forestry Experiment Station and the Mississippi State University Extension Service. This material is based upon work that is supported in part by the National Institute of Food and Agriculture, U.S. Department of Agriculture, Hatch project under accession number 081730, and Mississippi-Alabama Sea Grant Consortium using federal funds under Grant NA24OAR4170090 from the National Sea Grant Office, NOAA, U.S. Dept. of Commerce. The statements, findings, conclusions, and recommendations are those of the author and do not necessarily reflect the views of the National Sea Grant Program, NOAA, U.S. Department of Commerce. This newsletter is a Mississippi-Alabama Sea Grant Publication number MASGP-24-057-06.
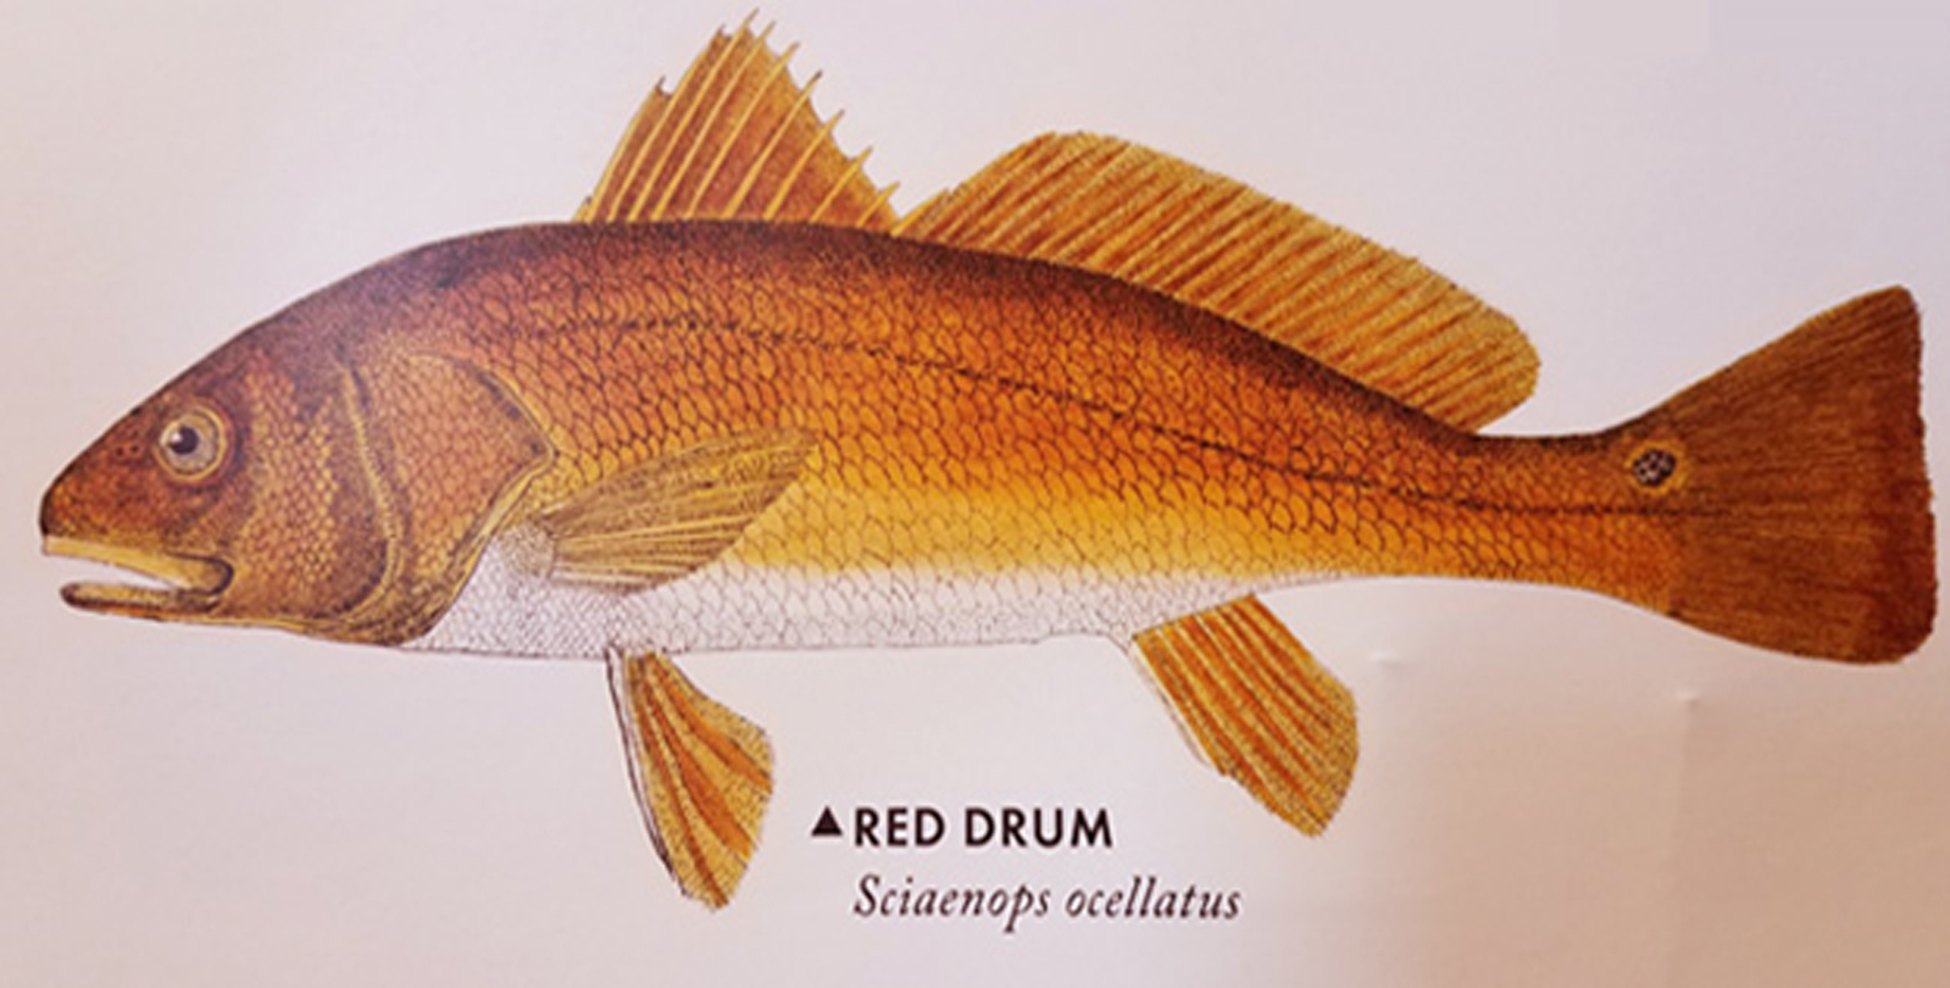
RED DRUM
- Scientific name: Sciaenops ocellatus
- Common Names: Bull Redfish, Channel Bass, Drum, Redfish, Spottail, Spotted Bass
- Source: https://www.seafoodwatch.org/recommendation/drum/red-drum-35520?species=314.
- Interest in the culture of red drums in captivity began in the late 1970s due to concerns about declining natural populations due to commercial and recreational fishing activities. Since then, various regulatory measures have been implemented (e.g., size and bag limits), and commercial fishing has been eliminated in many areas.
- Initial aquaculture methods were developed in the U.S., particularly in Texas and Florida, to provide alternatives to wild-caught fish and to enhance stock. With the development of reliable culture techniques, the commercial production of this
- species has expanded to other countries because the red drum is a popular food fish, relatively hardy, and adapts well to aquaculture conditions.
- Source: https://www.agmrc.org/commodities-products/aquaculture/aquaculture-fin-fish-species/red-drum-or-redfish.
STATUS OF RED DRUM AQUACULTURE
- The red drum is a marine species that spawns in near-shore areas, spends several years in coastal habitats, and then schools in offshore waters. It often lives to 30 – 50 years of age.
- The species occurs naturally from Veracruz, Mexico, to as far north as Massachusetts. Despite this, it is particularly vulnerable to sudden drops in temperature, and cold-related die-offs of juveniles in inshore habitats are common in wild populations. Similar cold-related losses are typical in outdoor culture ponds and tanks.
- Consumer interest in the red drum increased greatly in the U.S. in the mid-1980s, largely due to the temporary popularity of Cajun cuisine. As a result of overfishing, a subsequent moratorium on commercial harvests from the Gulf of Mexico led researchers and entrepreneurs to devote considerable resources in attempts to develop cultural techniques for this species.
- Source: https://www.agmrc.org/commodities-products/aquaculture/aquaculture-fin-fish-species/red-drum-or-redfish.
- Red drum is a commercially produced marine finfish species globally in Taiwan, China, Israel, Martinique, Mexico, Bahamas, Singapore, United Arab Emirates, Ecuador, and the United States.
- In the U.S., red drum are commercially cultured in Texas, Florida, South Carolina, and the U.S. Virgin Islands, with the majority (>85%) of production occurring in Texas.
- Broodstock management, reproductive biology, feeding behaviors, dietary requirements, growth and production requirements, and disease management are relatively well-known for red drum compared to other candidate marine aquaculture species.
- Despite being commercially produced for more than 30 years, few red drums have been reared to maturity for use as broodstock, and these individuals represent less than 5% of the broodstock inventory in the industry.
- Most red drum broodstock currently used in the U.S. was captured in the wild. Captive broodstock development and genetic improvement are major areas of research that could be undertaken to remove impediments to further industry expansion.
- Most red drum production facilities operate their own hatcheries and typically produce only what is needed to supply the culture facility, with little inventory left to supply producers or facilities that do not have the technical expertise or equipment necessary to operate a hatchery.
- Methods of production of juveniles to foodfish market size are well known. Outdoor pond production systems for growing out to foodfish size dominate this species' domestic and international industries.
- The red drum's market size has shifted from 0.7 kg to a desired market size of approximately 1.4 kg at the time of harvest. Depending on the mean temperature at the culture location, a 16-24-month production cycle is required to achieve these harvest weights.
- Best growth is achieved when using a starter diet for juveniles consisting of 50-55% protein and 15-17% lipid and quickly transitioning to a 44-45% protein, 13-16% lipid diet for foodfish grow out. Some producers decrease to a 40% protein, 13-16% lipid finishing diet for the last few months of production for larger fish.
- Red drum currently achieves U.S.$7.00-$7.70/kg live weight at harvest. With the continued ban on the commercial harvest of red drums from the Gulf of Mexico since the 1980s, many restaurants that serve traditional "redfish" dishes report shortages in availability, indicating room for market growth.
- Source: https://www.was.org/MeetingAbstracts/ShowAbstract/136040.
LET US START OUR MODELING EFFORT!
- Red Drum's commercial and recreational landings and dockside values in the United States and individual states since 1950 were compiled from the NOAA Fisheries website (https://www.fisheries.noaa.gov/foss/).
- U.S. recreational landings were reported starting in 1981. Major producing states were identified, and shifts in landings were measured.
- U.S. nominal dockside prices ($/lb) are imputed from commercial landings (lb/yr) and dockside values ($/yr).
- U.S aquaculture production and farmgate values from 2004 to 2021 were compiled from the Food and Agricultural Organization (FAO) Fish Stat data (https://www.fao.org/fishery/en/fishstat).
- Empirical commercial landings and aquaculture production models were developed, identifying significant determinants.
U.S. COMMERCIAL AND RECREATIONAL RED DRUM LANDINGS
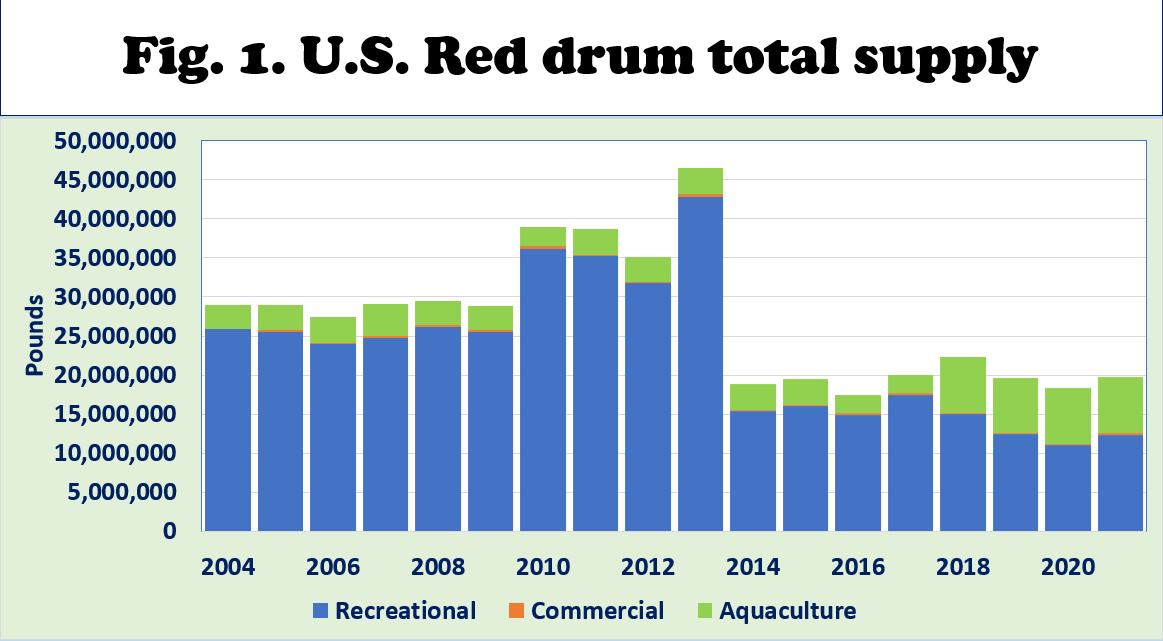
- Fig. 1 shows the total supply of red drum since 2004.
- It consists of commercial and recreational landings and aquaculture production in the U.S.
- Total supply peaked in 2013 at 43 million pounds.
- Recreational landings contributed an average of 82.4% of total supply since 2004.
- Commercial landings produced 0.8% of the total supply since 2004.
- Aquaculture production has added 16.8% of the total supply since 2004.
U.S. COMMERCIAL RED DRUM LANDINGS
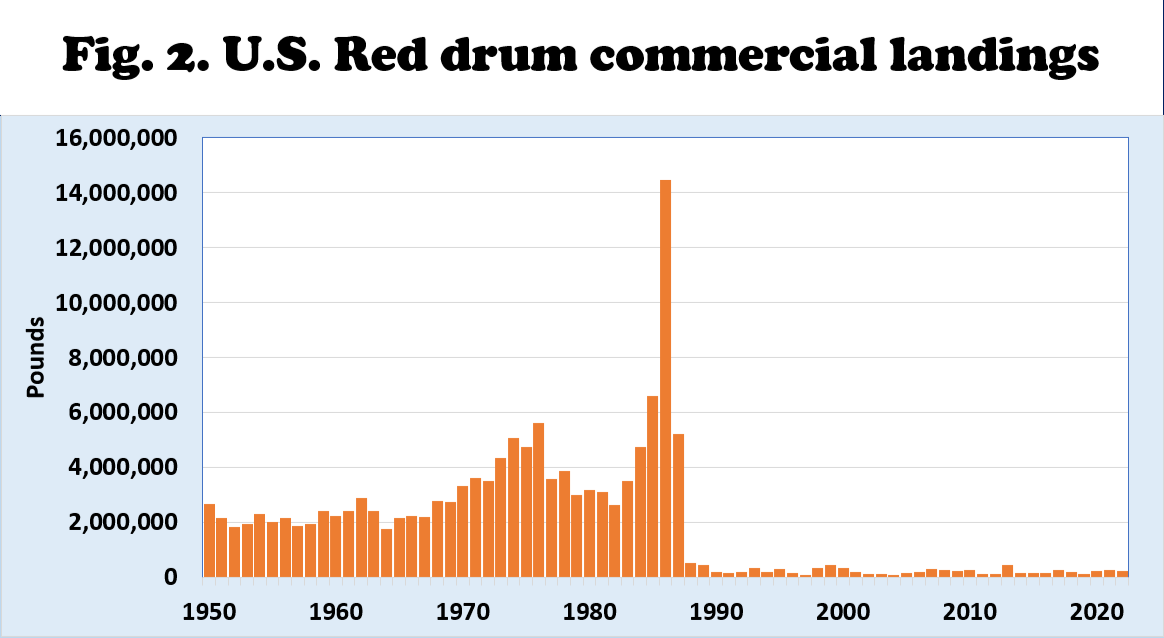
- Fig. 2 shows NOAA Fisheries data on commercial landings of Red Drum in the U.S. since 1950.
- Commercial landings peaked in 1986 at more than 14 million pounds and fell after a moratorium was imposed in 1987.
- Commercial landings contributed an average of 1% of total landings since 2010.
- Since 2010, commercial landings averaged 200,000 pounds per year.
U.S. RED DRUM RECREATIONAL LANDINGS
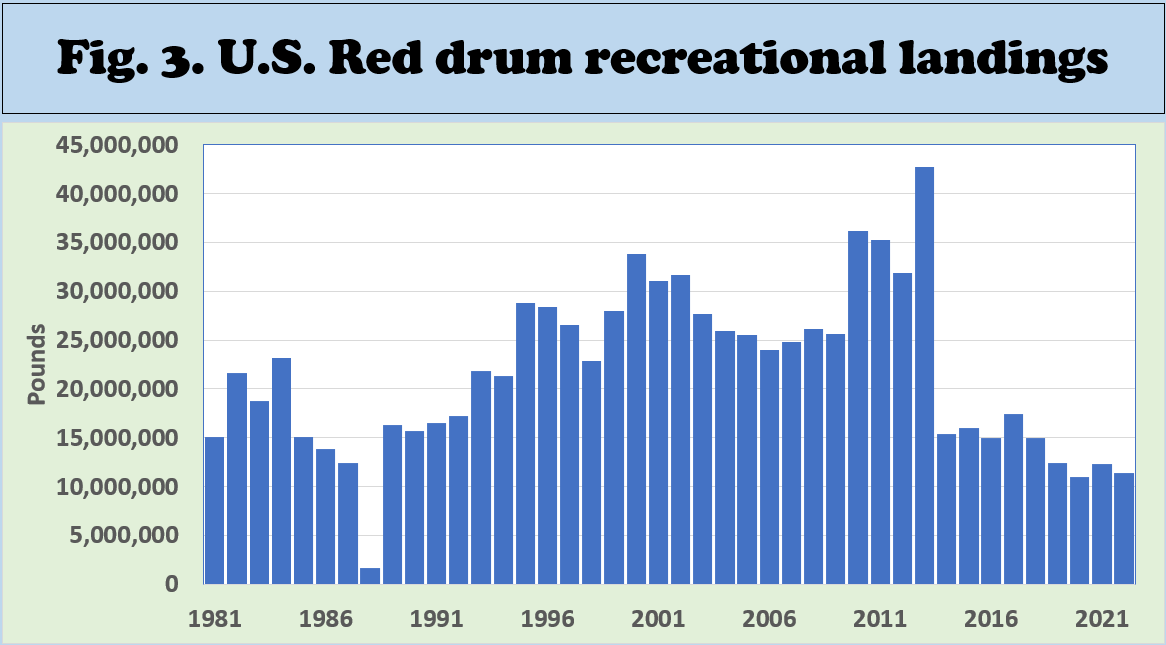
- Fig. 3 shows NOAA Fisheries data on recreational landings of Red drums in the U.S. since 1981.
- Recreational landings peaked in 2013 at more than 42 million pounds and had been falling after that.
- Recreational landings contributed an average of 99% of total landings since 2010.
- Since 2010, recreational landings have fallen below 15 million pounds annually.
U.S. RED DRUM AQUACULTURE PRODUCTION
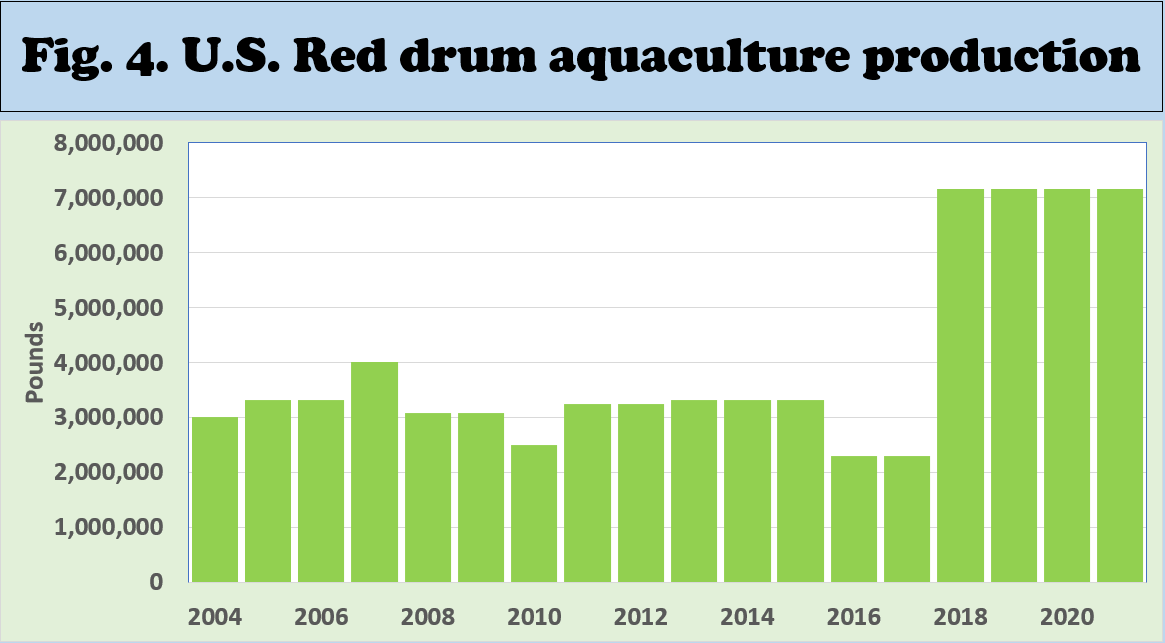
- Fig. 4 shows the FAO Fish Stat data on Red drum aquaculture production in the U.S. since 2004.
- Aquaculture production hovered around three million pounds but has risen to seven million pounds since 2018.
- However, the aquaculture production data reported by FAO from 2018 to 2021 have remained the same, requiring caution and further validation.
- Aquaculture farmgate values have averaged $12 million per year since 2010.
U.S. RED DRUM COMMERCIAL LANDING VALUES
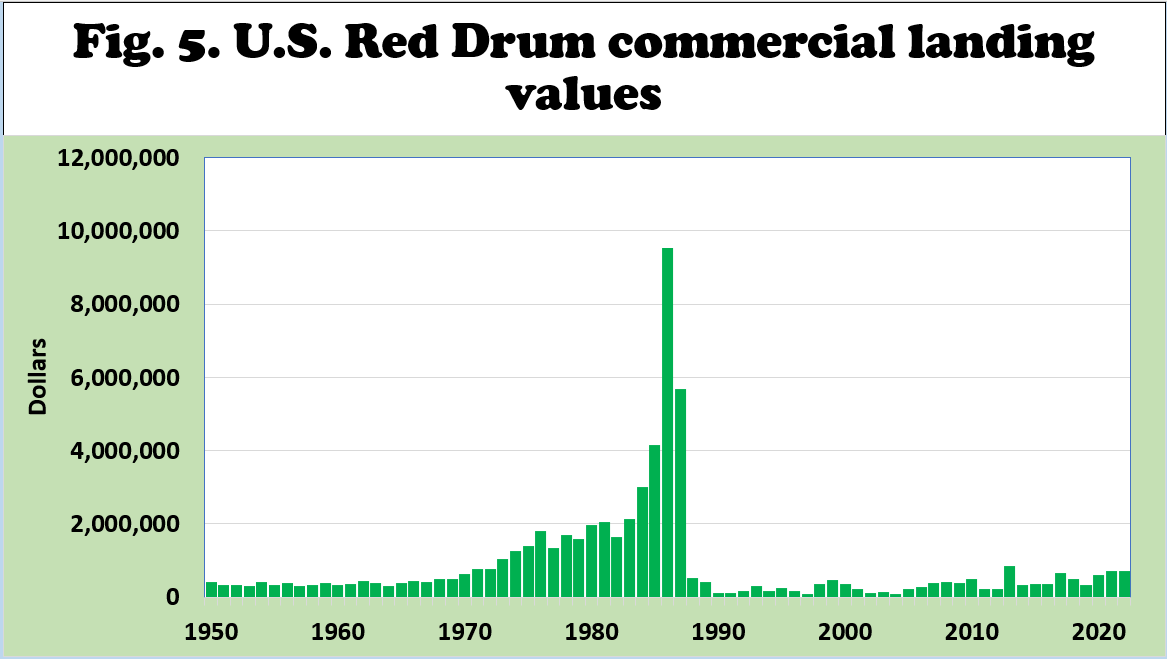
- Fig. 5 shows NOAA Fisheries data on commercial landing values of Red drum in the U.S. since 1950.
- Commercial landing values peaked in 1986 at more than nine million dollars and went downhill since the fishing moratorium was imposed in 1988.
- Commercial landing values have averaged less than 500,000 dollars since 2010.
U.S. RED DRUM COMMERCIAL LANDINGS BY STATE
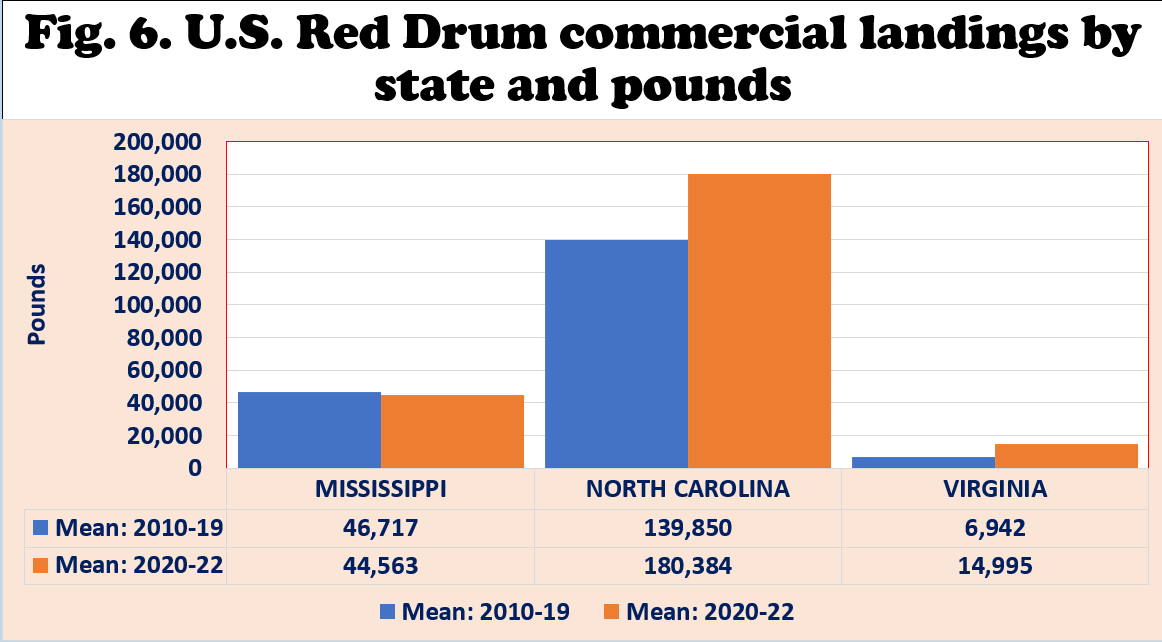
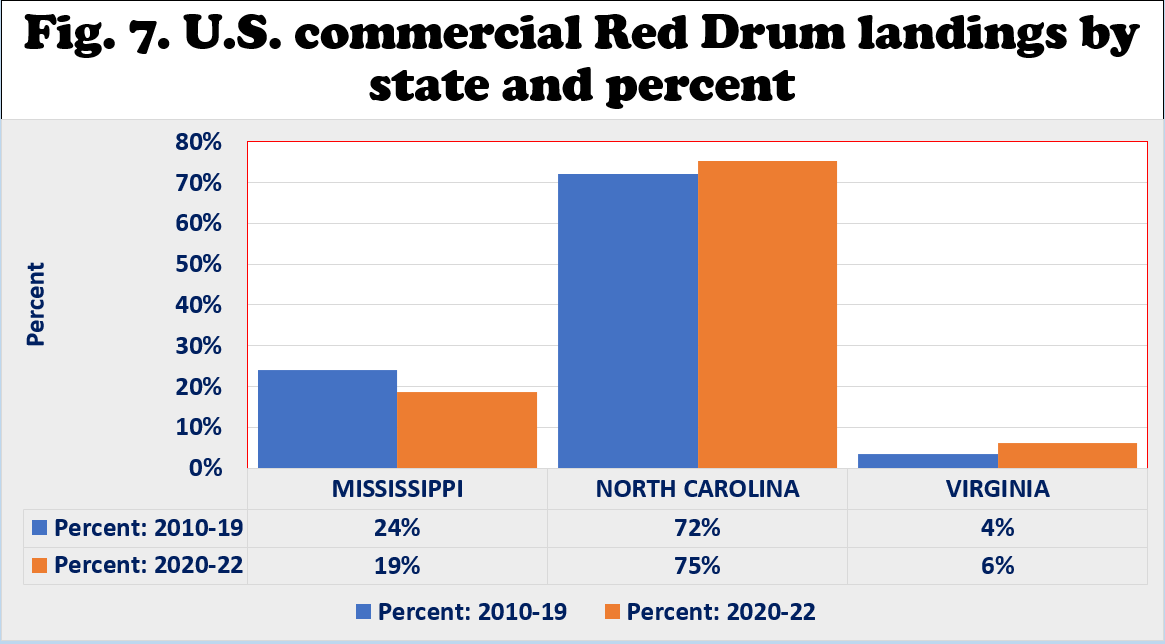
- Fig. 6 shows the major producing states from 2010 to 2022, including North Carolina, Mississippi, and Virginia.
- Only Mississippi has a commercial fishery in the Gulf of Mexico.
- The total allowable catch for red drum is 60,000 pounds in Mississippi and 250,000 pounds in North Carolina.
- The size and number of daily catches are imposed in all three states.
- As Fig. 6 and 7 show, North Carolina produced 139,850 lb/yr from 2010 to 2019. Its share of total U.S. commercial landings rose from 72% in 2010-19 to 75% in 2020-22.
- Mississippi landed 46,717 lb/yr in 2010-19. Its share of total U.S. commercial landings fell from 24% in 2010-19 to 19% in 2020-22.
- Virginia landed 6,942 lb/yr in 2010-19. Its share of total U.S. commercial landings rose from 4% in 2010-19 to 6% in 2020-22.
U.S. RECREATIONAL RED DRUM LANDINGS BY STATE
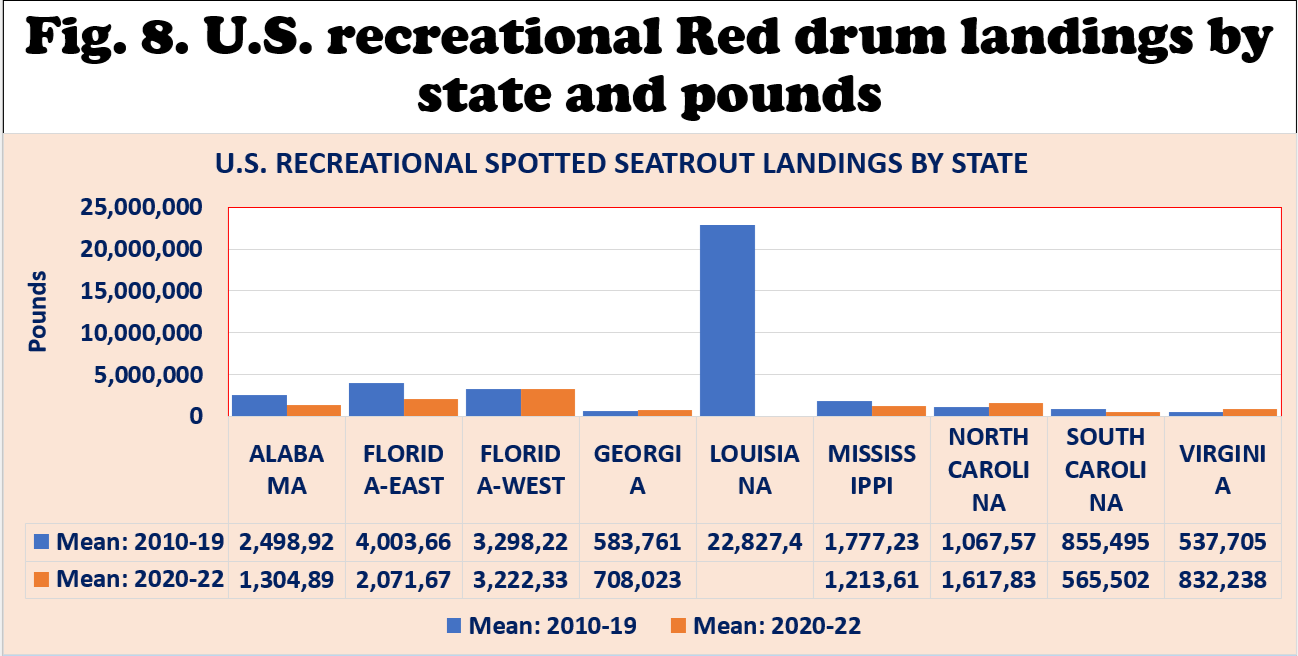
- Fig. 8 shows the major producing states from 2010 to 2022. Louisiana’s average red drum landings from 2010 to 2013 averaged more than 22 million pounds annually. However, no recreational red drum landings have been reported in Louisiana since 2014.
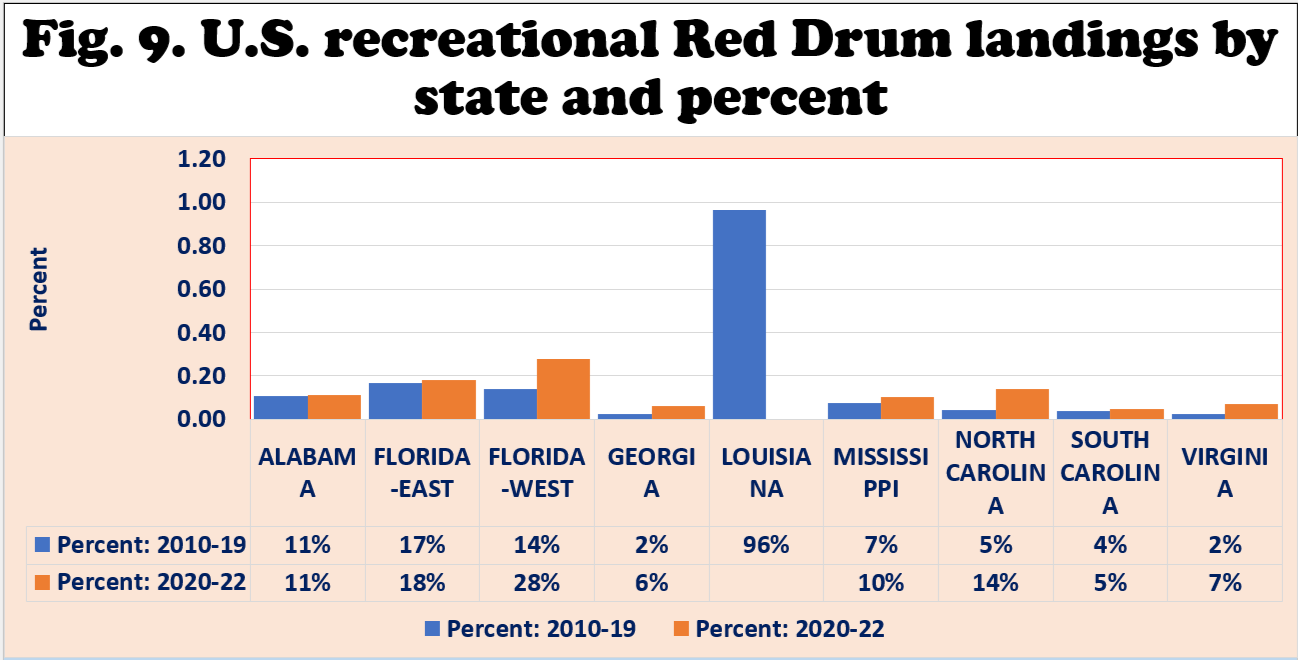
- As Fig. 8 and 9 show, Alabama landed 1.3 million lb/yr, or 11% of total recreational landings in 2020-22.
- Florida East Coast landed 2.0 million lb/yr or 18% of total U.S. recreational landings in 2020-22.
- Florida West Coast produced 3.2 million lb/yr or 28% of total U.S. recreational landings in 2020-22.
- Georgia landed 0.7 million lb/yr or 6% of total U.S. recreational landings in 2020-22.
- As Fig. 8 and 9 show, Mississippi landed 1.2 million lb/yr, or 10% of total recreational landings in 2020-22.
- North Carolina landed 1.6 million lb/yr or 14% of total U.S. recreational landings in 2020-22.
- South Carolina produced 0.5 million lb/yr or 5% of total U.S. recreational landings in 2020-22.
- Virginia landed 0.8 million lb/yr or 7% of total U.S. recreational landings in 2020-22.
IMPUTED U.S. COMMERCIAL RED DRUM DOCKSIDE PRICES
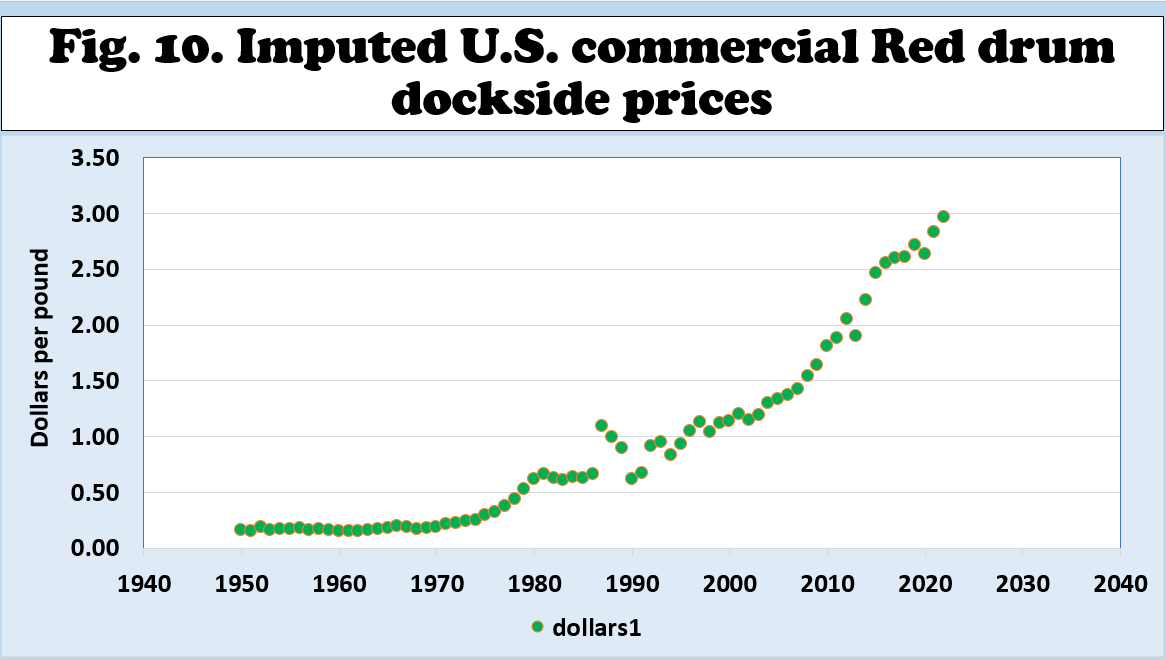
- The imputed dockside prices of red drums in the U.S. are shown in Fig. 10.
- U.S. dockside prices of red drums have continued to rise and peaked in 2022 at $2.96 per pound.
- Since 2010, the imputed dockside prices of red drums averaged $2.40 per lb (standard deviation = 0.39) or a coefficient of variation of 16%.
- Since 2010, the real imputed dockside prices of red drums averaged $2.49 per pound (standard deviation = 0.25) or a coefficient of variation of 9%.
IMPUTED U.S. COMMERCIAL RED DRUM DOCKSIDE PRICES AND COMMERCIAL LANDINGS
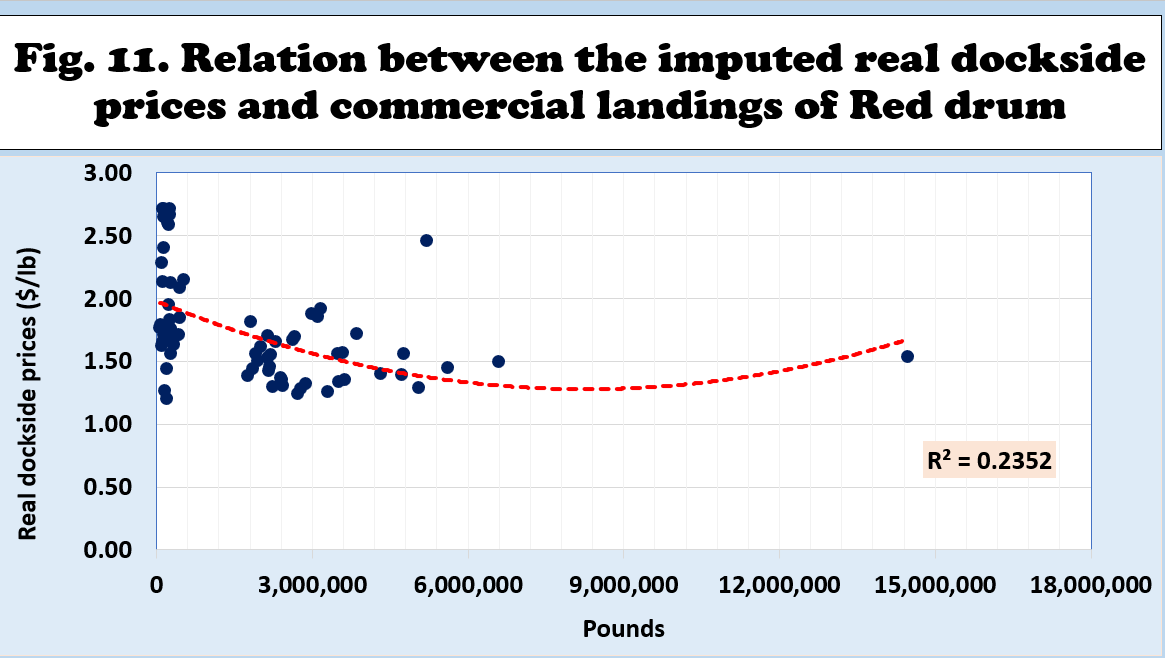
- Fig. 11 shows the empirical relationship between the imputed real dockside prices and commercial landings in the U.S.
- The imputed real dockside prices tended to fall at higher commercial landings.
- When annual commercial landings rose above three million pounds, the imputed real dockside prices flattened below $1.50 per pound.
U.S. RETAIL RED DRUM MARKET
- There are no reports of retail prices of fresh and frozen Red drum in the 26 locations monitored by Urner Barry Comtell (UBC).
MARGINAL EFFECTS ON U.S. RED DRUM COMMERCIAL LANDINGS
- A significant double-log regression equation was estimated with commercial landings as the dependent variable.
- The estimated equation explained 85% of the variations in commercial landings.
- Three independent variables significantly influenced commercial landings.
- Trade wars and higher recreational catch seemed to have encouraged more domestic production.
- The fishing moratorium significantly reduced commercial landings.
MARGINAL EFFECTS ON U.S. RED DRUM DOCKSIDE VALUES
- A significant double-log regression equation was estimated with real landing values as the dependent variable.
- The estimated equation explained 83% of the variations in real landing values.
- One independent variable significantly influenced commercial landing values.
- The occurrence of recessions diminished commercial landing values.
MARGINAL EFFECTS ON U.S. RED DRUM REAL DOCKSIDE PRICES
- A significant double-log regression equation was estimated with real dockside prices as the dependent variable.
- The estimated equation explained 49% of the variations in real dockside prices.
- Three independent variables significantly influenced real dockside prices.
- Dockside prices significantly fell during recessions and rose during trade wars and the imposition of the moratorium.
MARGINAL EFFECTS ON U.S. RED DRUM AQUACULTURE
- Three double-log regression equations were estimated with aquaculture production, real farmgate values, and real farmgate prices as the dependent variables.
- Regression results show that the imposition of trade wars enhanced domestic aquaculture production and real farmgate values.
- On the other hand, no independent variables were identified to have significantly affected the imputed real farmgate prices.
MISSISSIPPI RED DRUM COMMERCIAL AND RECREATIONAL LANDINGS
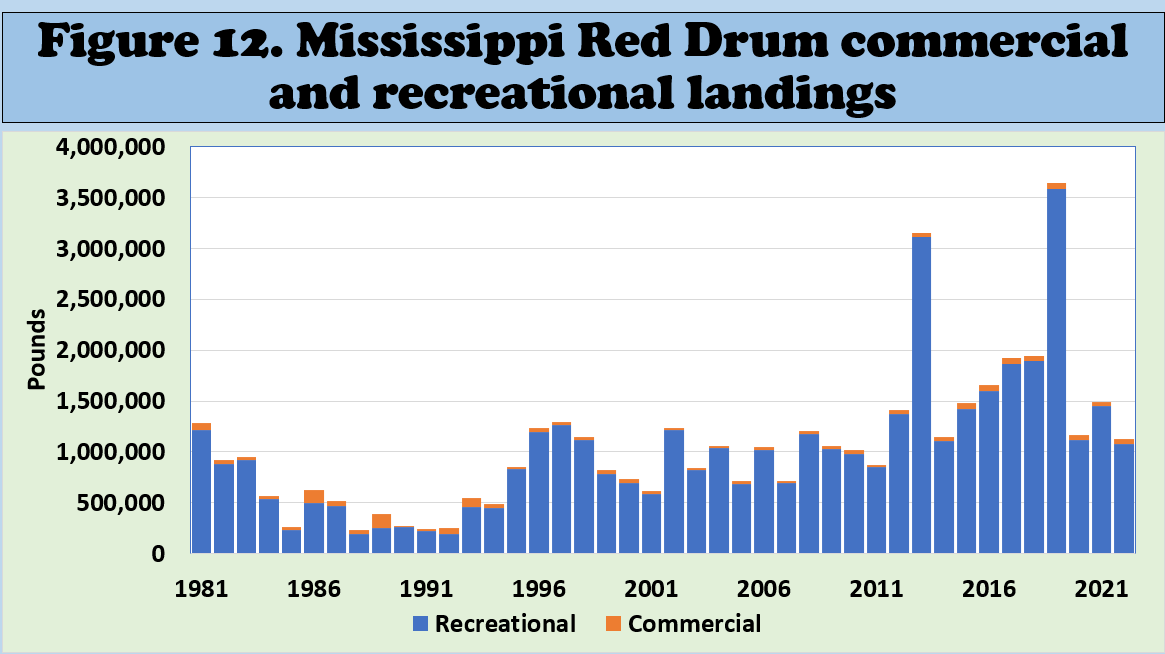
- Fig. 12 shows the annual commercial and recreational landings from 1981 to 2022.
- Total landings peaked in 2013 and 2019 at 3.15 and 3.64 million pounds, respectively.
- Recreational landings consisted 97 percent of total landings.
MISSISSIPPI RED DRUM RECREATIONAL LANDINGS
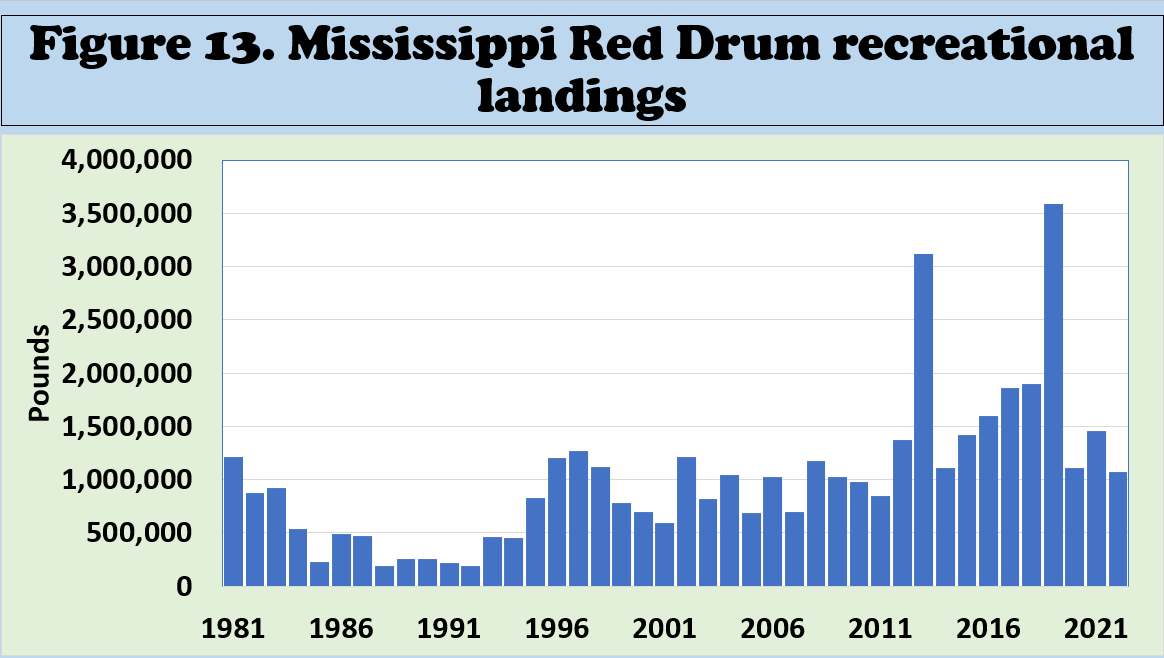
- Fig. 13 shows the annual recreational landings from 1981 to 2022.
- Recreational landings peaked in 2013 and 2019 at 3.11 and 3.58 million pounds, respectively.
- Recreational landings averaged 1.78 million pounds from 2010 to 2019 but fell to 1.21 million from 2020 to 2022.
- Recreational landings contributed 97 percent of total landings.
MISSISSIPPI RED DRUM COMMERCIAL LANDINGS
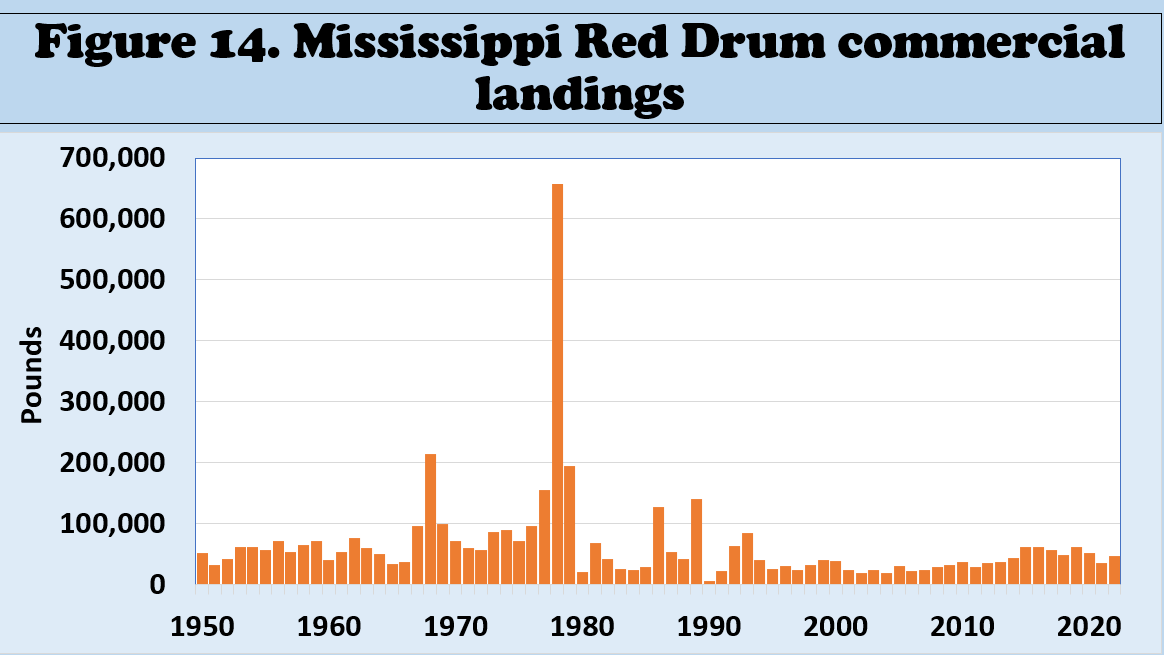
- Fig. 14 shows the annual commercial landings from 1950 to 2022.
- Commercial landings peaked in 1978 at 658,000 pounds.
- Commercial landings averaged 46,700 pounds from 2010 to 2019 but fell to 44,500 from 2020 to 2022.
- Commercial landings contributed three percent of total landings.
SUMMARY, LIMITATIONS, AND IMPLICATIONS
- Since 2010, U.S. commercial landings have averaged 204,000 pounds annually, contributing 1% of total landings. The major commercial-producing states are North Carolina, Mississippi, and Virginia.
- Since 2010, the reported U.S. recreational landings have averaged 20.9 million pounds annually, contributing 99% of total landings. Florida West Coast, Florida East Coast, North Carolina, Alabama, and Mississippi are the major recreational-producing states.
- Limited recreational landings are reported in Georgia, South Carolina, and Virginia. No recreational landings have been reported in Louisiana since 2014.
- U.S. nominal dockside prices have continued to rise and peaked in 2022 at $2.96 per pound. It averaged $2.40 (±0.39) per pound since 2010. In real terms, it averaged $2.49 (±0.25) per pound since 2010.
- Mississippi's total landings peaked in 2019 at 3.64 million pounds, with recreational landings consisting of 97 percent.
- Mississippi commercial landings have averaged 46,700 pounds per year since 2010.
- U.S. aquaculture production data are limited and should be used cautiously.
SUGGESTED CITATION
Posadas, Benedict C. 2024. Potential U.S. Markets for Red Drum Aquaculture. Mississippi MarkeMaker Newsletter, Vol. 14, No. 6. Mississippi State University Extension and Mississippi-Alabama Sea Grant Publication number MASGP-24-057-06. (20 pages). June 27, 2024. https://extension.msstate.edu/newsletters/mississippi-marketmaker.
For accessibility assistance please contact Ben Posadas at ben.posadas@msstate.edu


