Using Google Earth to Estimate Shoreline Erosion History
When evaluating a shoreline for possible implementation of a living shoreline project, one of the most important site characteristics to assess is the erosion history of the site. An easy and free way to do this is to use Google Earth and Microsoft PowerPoint.
Using these tools, you should be able to quickly determine if a site has been experiencing erosion or if it is relatively stable. You may also be able to determine the cause of erosion at a site using this activity alone or in combination with property owner interviews.
This guide serves as a step-by-step tutorial to help anyone to be able to do shoreline erosion assessments using this common software. However, this is a rough evaluation of erosion at a site. It should not be used to measure exact erosion rates or amount of land lost.
Erosion history can indicate:
- Suitability for living shoreline implementation
- The need for wave-breaking structures
Programs Needed
- Google Earth
- PowerPoint
How to Download Google Earth
- Go to www.google.com/earth. This example uses Google Chrome, but other browsers will also work.
- Select Earth Versions.
- Select Google Earth Pro on desktop.
- Select Download Earth Pro on desktop.
- Select Accept & Download.
- Click the execute command and select Yes to allow changes to your computer.
Welcome to Google Earth!
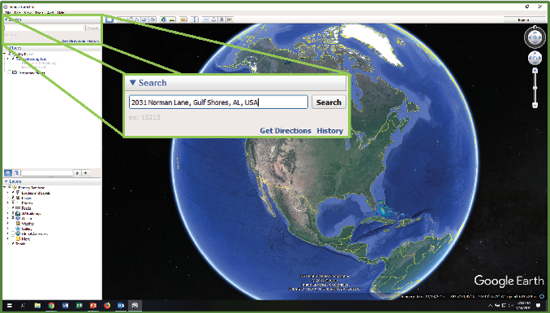
1. Enter a location into the search bar.
2. Go back in time. In this example, 1992 is the date chosen.
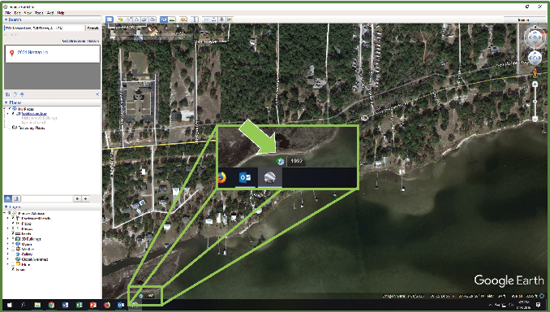
3. Zoom in as much as possible while still being able to discern the shoreline.
a. You can zoom in by pressing the plus button, scrolling up with the mouse wheel, or zooming in on a touchpad.
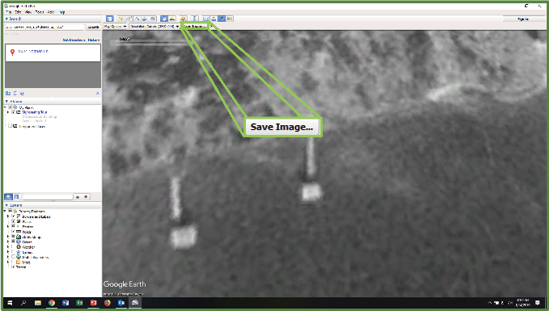
4. Save the zoomed-in image. Be sure to include the year in the name of the picture file!
5. Set the picture as the slide background in PowerPoint.
a. Select Format Background.
b. Select Picture or texture fill, and then, under Insert picture from, choose File.
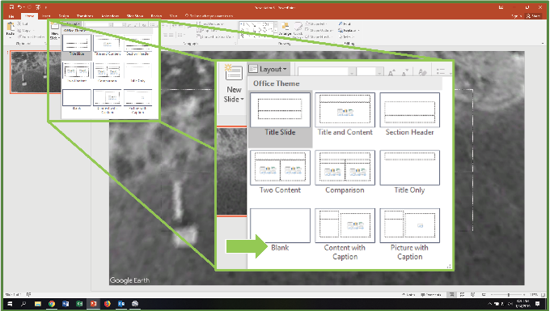
6. Get rid of text boxes.
a. Choose Layout.
b. Choose the blank slide option.
7. Trace the shoreline.
a. Choose the free draw tool.
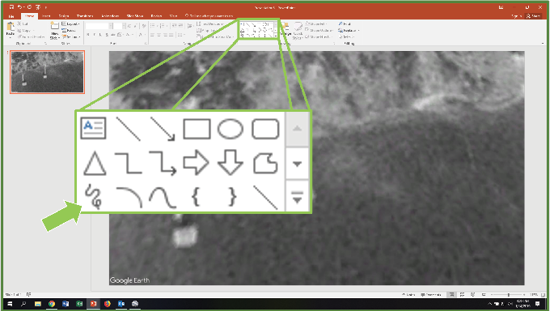
b. Use your mouse to draw along the shoreline.
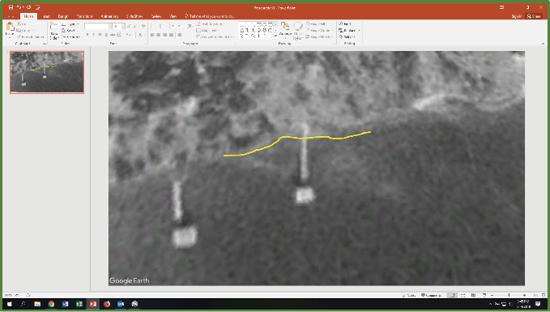
c. To change the color and width of the line, choose Format Shape.
8. Trace reference lines.
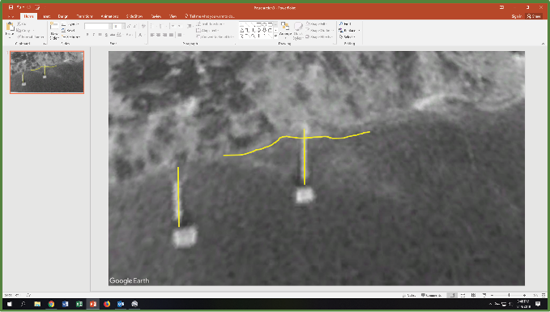
9. Group the tracings together.
a. Select all by holding down shift and clicking each.
b. Choose Arrange, and then Group.
10. Save a later image from Google Earth.
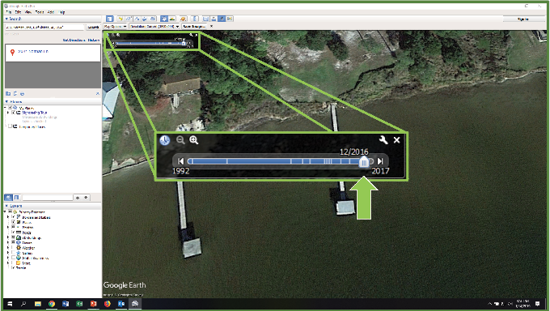
11. Set the second image as the background on a new PowerPoint slide. (See step 5 for instructions.)
12. Add the shoreline tracings from the first image to the second image.
a. Select the tracings in the first image, and then select Copy.
b. Go to the new image and paste.
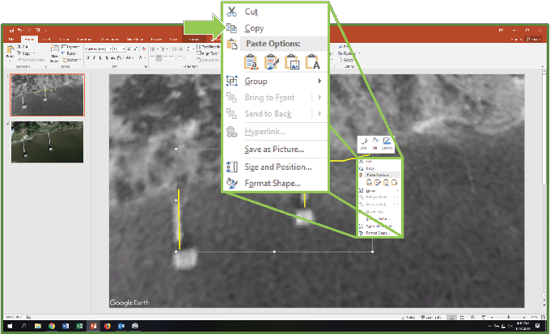
13. Use your reference lines to adjust your shoreline tracing.
a. Use the rotate button to rotate the image by dragging in the direction needed to line up your reference lines.
b. By dragging the dots, you can change the shape, width, and height of the grouping.
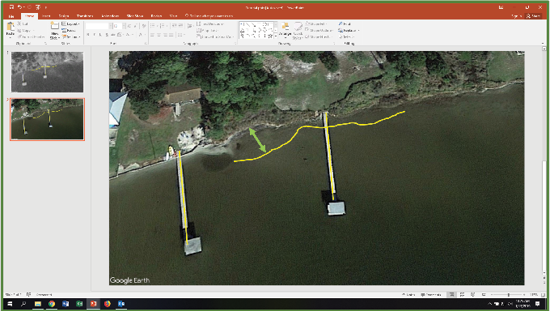
14. How to interpret the pictures: The space between the shoreline tracing and the more recent shoreline is the area of erosion.

For more information
Visit http://masgc.org/living-shorelines or email eric.sparks@msstate.edu.
The information given here is for educational purposes only. References to commercial products, trade names, or suppliers are made with the understanding that no endorsement is implied and that no discrimination against other products or suppliers is intended.
Publication 3357 (POD-05-22) MASGP-19-029
By Sara Martin, Extension Associate, and Eric Sparks, PhD, Associate Extension Professor and Director, Coastal and Marine Extension Program.
The Mississippi State University Extension Service is working to ensure all web content is accessible to all users. If you need assistance accessing any of our content, please email the webteam or call 662-325-2262.


