
A Guide for Disseminating Urban Wildlife Data with ArcGIS StoryMaps for Urban Wildlife Information Network Partners
Overview
The field of urban wildlife is full of both biological and cultural diversity. The different species that live alongside us have their own unique behaviors and lives—their stories, so to speak. Similarly, the communities that urban wildlife inhabit have their own stories that include significant cultural events and history. Researchers have the unique job of weaving these narratives together to better understand human-wildlife interactions. When expertly crafted, these stories can be a useful educational tool for engaging the public about the cultural history and urban wildlife of our communities.
Our team with the Mississippi State University Extension Service, in partnership with the Urban Wildlife Information Network (UWIN), has curated these stories through ArcGIS StoryMaps. Created by Esri, this online platform allows creators to share comprehensive “storytelling” experiences through features such as text, digital media, and interactive maps. Through StoryMaps, our team has been able to provide the foundational depth of the biological and cultural story while also bringing it to life through user interaction.
Using interactive maps to tell stories offers a variety of benefits. Maps help users visualize data in an easy-to-digest format and can express both simple and complex concepts. Additionally, interactive maps allow users to tailor their educational experience by selecting and focusing on the geographical areas and subject matter that they are most interested in.
As mapping software can be expensive and often requires professional training and experience to create comprehensive digital maps, StoryMaps provide an alternative to more advanced map creation and website hosting. StoryMaps is designed for people who are less familiar with mapping software and simplifies many of the steps that often inhibit would-be creators. Like all ArcGIS Online (AGOL) products, StoryMaps is entirely cloud-based and hosted by Esri, giving more freedom to creators who may not have a website of their own. In short, it’s an attractive option for individuals or organizations who wish to display their project data as a linear and interactive story suitable for a wide audience.
This guide introduces several StoryMaps features that are used for the Jackson Urban Wildlife Project, or JAMS, website. (JAMS is short for Jackson, MS.) It also provides instructions on how to create and use the features to disseminate urban wildlife information. We hope that other UWIN partners will find this guide useful and informative for creating websites of their own. We encourage readers to refer to our site as a visual supplement while reading this publication.
Getting Started
An AGOL account is needed to create and edit story maps. Potential story map creators have two different account options to choose from: a free public account or a subscription-based Creator and GIS Professional account. Those using a free public account will have access to fewer StoryMaps features, limited design options, and no access to other Esri products. Click here to compare these account types.
Except for the Image Gallery, every feature we use in our JAMS story map is available with the free version. However, if you wish to try other features or want more creative control, consider purchasing the subscription-based version. Partners who belong to a university, government agency, or other large organization may have access to an existing Esri license and should contact the relevant department for more information.
ArcGIS StoryMaps vs. StoryMaps.com
Partners also have the option of using a separate StoryMaps website not tied to the AGOL suite through StoryMaps.com. This website also offers both a free basic plan and a premium plan. While the functionality of ArcGIS StoryMaps and StoryMaps.com is the same, their basic plan offerings differ. Click here for a full list of StoryMaps.com features.
The pricing for the StoryMaps.com premium plan is significantly less than an AGOL Creator and GIS Professional plan. For partners who plan to use only story maps without potentially expanding into other AGOL applications, the StoryMaps.com premium plan may be the better option. Creators who choose this option will still be able to reference the following guide to create their story map page with little discrepancy, but please keep the difference of both services in mind. Click here to compare the two services.
Creating a New Story Map
All personal unpublished and published story maps can be accessed here. Published maps belonging to an organization or group will also be available on this page in a separate tab. Click here to access unpublished maps in a group. You can also reach this page through the user page by clicking on the user icon in the sidebar near the top right-hand corner, then selecting view all under the “groups” header.
Tip: When working with multiple team members on a story map, we recommend creating a Shared Update Group for easy collaboration. Shared Update Groups let members access all content added to the group and allow multiple people to work on the same map. Additionally, all changes are automatically shared. If you’re using an organization’s existing Esri subscription, the relevant department should be contacted to create a Shared Update Group. This function is available only for paid accounts. If you’re using the free version, the best alternative may be to create one account that multiple people can access.
To create a new story map, select the new story button and select start from scratch from the drop-down menu. This will automatically launch the story builder and open a blank story map. Creators can edit the story map’s title, subtitle, and byline. Click any text to make edits. Media can also be uploaded to this header using the add cover image or video button. This media, along with the title and related text, make up the story map cover (i.e., the header for the page).
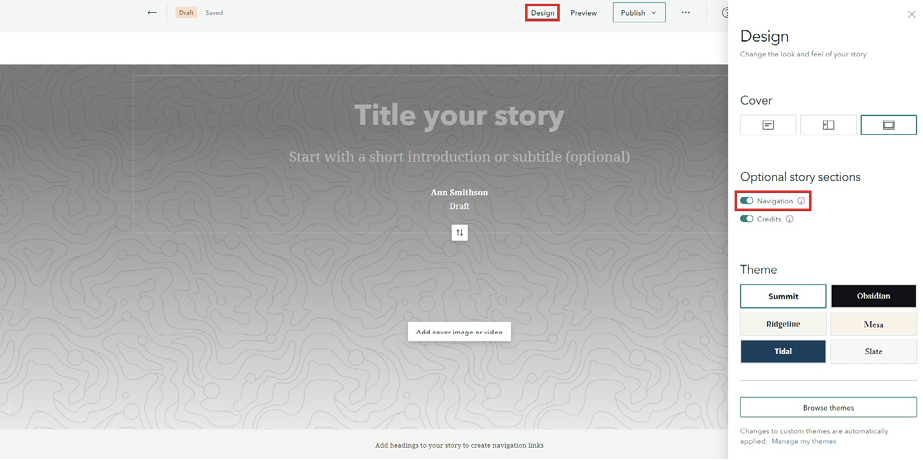
In the top sidebar, choose the design option to change the layout. You can also adjust the way the cover text and media are displayed. Several optional functions can be toggled on and off. In the optional story section, enable the navigation function to create a navigation bar underneath the cover (Figure 1).
StoryMaps themes can also be chosen on this page. Currently, there are six premade themes available to all account types. If you’re working within an organization that has an existing Esri subscription, there may be a premade theme that meets your organization’s visual identity standards already available. To select a premade theme, click browse themes and navigate to the organization tab. Custom themes can also be created through this process. Please note that custom themes are only available to users with an Esri subscription.
The final section allows creators to upload a logo for their page. The size of any uploaded logos will automatically be minimized to a 50-by-50-pixel image. It will appear in the top left corner of the story map.
Creating and Adding Content
To create content, locate the encircled + symbol on the left-hand side of the story map page. This is called add content block. Clicking it will open a drop-down list of content types or features. The different types of features that are available will differ depending on the account type.
StoryMaps uniquely allows creators to build the data visualization capabilities of AGOL products into an ongoing narrative. To this point, we found it useful to begin our story map with text, videos, and imagery to introduce our project before jumping into the mapping components. Partners may find it useful to adopt a similar strategy and share information specific to their projects, as well as any information about their location or local wildlife relevant to the project.
To add text, click the “Text” option. This will create a new content block and pop-up toolbar. Creators can adjust font design, add links, and change paragraph alignment with this toolbar. This pop-up can be accessed at any time by highlighting the text (Figure 2).

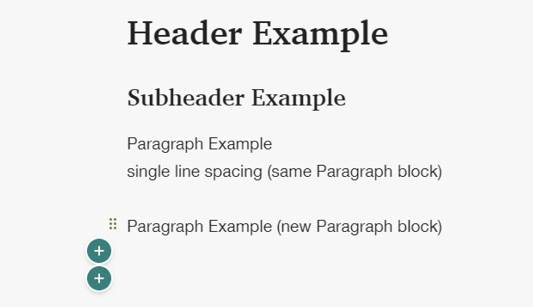
Paragraph is the default style for displaying text. To change this style, select a new format from the drop-down list in the pop-up. Headings are the main organizational delineation for StoryMaps and will appear as tabs in the navigation bar at the top of the page.
Pressing the enter key while typing will create a new content block. To continue typing in the same content block, press the shift-plus-enter key combination (Figure 3).
To delete text content blocks, clear all text from the block and press the backspace or delete key.
Tip: Esri has recently implemented shortcuts for editing text in StoryMaps. Click here for a list of all shortcuts.
Separate content by inserting a separator from the add content block list. The separator’s design is determined by the theme.
To reorganize content, locate the set of six dots in a rectangle on the left side of each content block. Click the dots and drag the content to its desired location.
Tip: While StoryMaps does have undo and redo functions, these features are currently in beta and are not always reliable. It is important to save any longform text in a separate file or document in case it cannot be recovered from the story map.
Creating a Map Tour
Once you’re comfortable with adding basic content, you can begin adding maps to your story map pages. The main map featured on our JAMS basic webpage is called a Map Tour. A Map Tour allows creators to showcase multiple geographic locations through individual points on a map. Clicking on these points will zoom users further into the map. Map Tours also include a legend, allowing users to choose a point from a list rather than from the map itself. The legend provides space for additional information regarding each point as well.
Exploring Map Tour Design
This style of map allows partners to choose points of interest as they please. It also does a good job of showing an area of study and more specific details for each site. Site descriptions could include information about the location (if it is a historical site), details on the animals seen there, and so on. The media section can also help enhance any shared information.
This type of map is a great option for an organization or team that does not have access to Esri mapping products, as all data can be entered manually. Please note, however, that any future changes or updates must also be done manually.
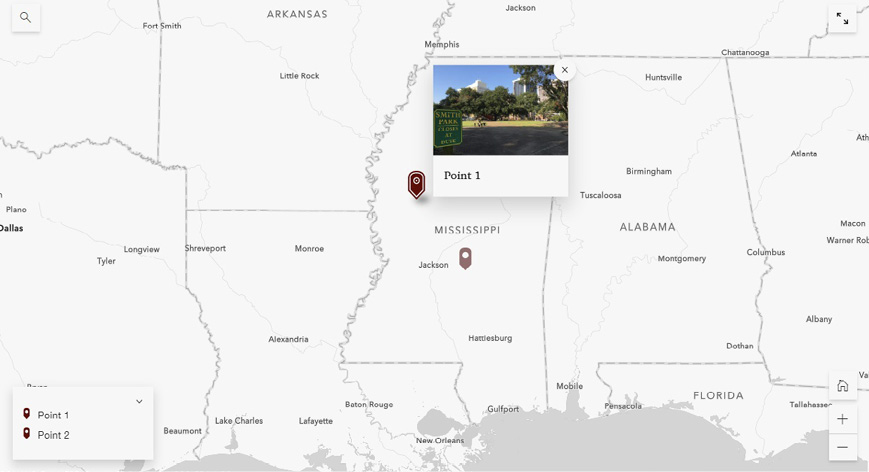
Map Tours are one of the features available when adding a new content block. Creators can build a Map Tour from scratch, use geotagged photos to populate points, or use existing ArcGIS data. For our map, we chose to build from scratch and use the explorer and list configuration. This configuration allows users to navigate the list of sites more freely while also sharing the most amount of information at first glance (Figure 4).
To edit the map design, click on the map options button in the top right corner. Creators have the option to change the type of map used (referred to as the basemap), the point color, and the default zoom level. For our map, we used the imagery (hybrid) basemap. Creators can manually set the default zoom level for the map as well. Since our project area is small, our custom zoom level is set to cities. Adjust accordingly depending on the area of study.
Adding Locations to the Map Tour
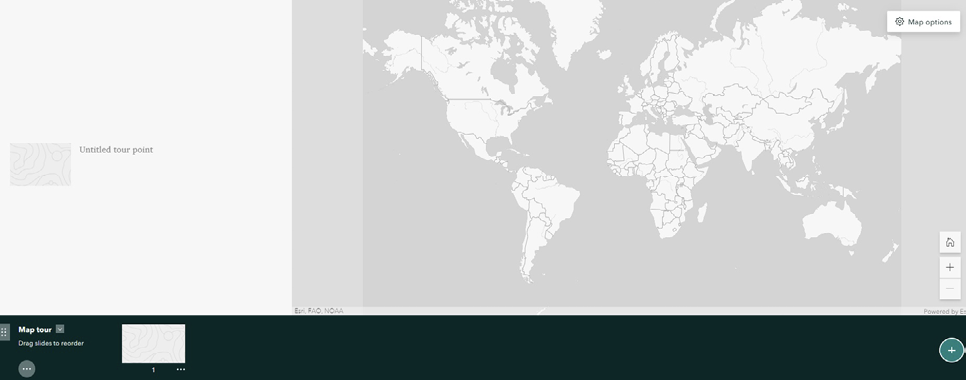
The Map Tour locations are organized in the toolbar at the bottom of the map. A location point should be automatically created once a new Map Tour is created. Click on the point in the sidebar to make edits. The options to add a title, a brief description, media, and a location will become available.
To add a point marker to the map, select add location. This will open the tour point location screen. Creators can manually place the point marker, or search for a physical address in the search bar in the top right. The map will then ask the creator to confirm the location, and the point marker will be dropped on the map. If needed, the point marker can be moved by left-clicking and dragging to the desired location.
Tip: StoryMaps allow creators to preview the page before publishing. Additionally, this preview function shows what the published story map will look like on different devices (desktop, smartphone, and tablet). Consider which device the primary audience will likely use, as this may affect what design elements and content blocks will be most suitable.
Tip: Please be aware that dropping a point marker near the actual camera location (or other sensitive sites like dens, etc.) could endanger the research or animal. For our project, we offset the point marker from the actual camera location and simply used the center point of the research site itself.
Unwanted points can also be deleted by left-clicking the marker and dragging it into the trash can icon at the bottom of the screen, then dropping it. Markers can be de-selected by clicking anywhere on the map.
Additionally, creators will have the option to choose the zoom level of a point. To zoom in closer to the location when the point is selected, choose use the current zoom level and adjust the zoom level on the tour point location map to the desired level. Make note of this level for uniformity purposes for future points. Use Map Tour settings will not change the map zoom level when the point is selected. Creators can change the point location and/or the zoom level at any time by clicking on the point on the Map Tour and selecting the edit location button.
The point title is typically the public name of the location, such as the name of the park. If the location does not have a public name, partners may wish to use the naming convention used in their project. For sites with multiple cameras, dens, etc., we recommend consolidating locations into one listing.
If adding a description, we strongly recommend limiting it to bulleted “quick facts” instead of paragraph form for readability. Text in the description may also be hyperlinked and can direct users to a different story map or an external site. Options for expanding on these basic descriptions will be discussed later in this guide.
Adding Additional Media to the Map Tour
Images or videos can also be added to each point by clicking on the relevant button. Once uploaded, media can be edited by clicking on the pencil icon in the image toolbar. Media can be cropped, rotated, and edited for stylistic purposes.
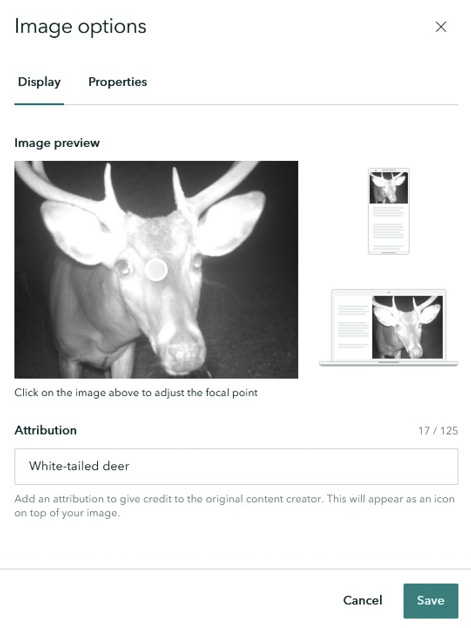
Clicking on the gear icon in the image toolbar will take creators to the image options page. This page allows creators to change the cropping of uploaded media as displayed when published, as well as add attributions and alternative text. This page also shows a preview of what the media will look like on different devices. We will discuss the image options page in more detail later in this guide.
To add more media to a point, click the + option in the image toolbar. Repeat the steps mentioned above.
Repeat the process outlined above to add points for all sites. New points will appear in the slide section at the bottom of the map. To reorder points, click and drag the slides.
Map Tours work on a 1:1 basis, meaning every point is tied to one location on the map and one description in the sidebar. For more interactive content, such as a map highlighting the different locations where an animal species is found, more advanced Esri software and skills will be required. More details on this approach are in the following section.
Tip: Since our project uses a combination of public and private sites, we opted to show only the public sites on our story map. If including private sites, partners may wish to reach out to the owners or relevant contacts and confirm they are comfortable having their properties listed on the map.
Click here for more instructions on creating and using Map Tours.
Creating Express Maps
Another type of map compatible with StoryMaps is called an Express Map. Like Map Tours, Express Maps work on a 1:1 basis and require manual input. Media and a brief description can also be added to points.
However, Express Maps do not feature the scrolling legend seen in Map Tours. Instead, creators can toggle on a fixed legend that will appear in the bottom left corner. Additionally, the information added to each point will appear as a pop-up on the map itself rather than in a sidebar. There is no option to automatically zoom in if a point is selected (see Figure 5 on page 8).
Express Maps may be the better option if a project has fewer distinct camera locations. For example, if a study takes place entirely within a greenspace, or along a continuous feature like a river or bike trail, an Express Map may be more suitable. Express Maps also permit the use of drawn features, which may be more useful if partners wish to highlight certain areas rather than points.
To create an Express Map, create a new content block and select map from the feature list. Then, select + new Express Map in the top right corner. The interface for creating an Express Map is a combination of the map options and add location interfaces seen when creating a Map Tour. All points and drawn figures are added directly to the map via the map toolbar at the top of the edit Express Map screen.
Click here for more detailed instructions on creating an Express Map.
Employing Advanced Mapping
If neither the Map Tour nor the Express Map options are optimal for the type of data a partner would like to showcase, more advanced GIS products can be used to create a product and embed it within a story map. Please note, however, that this option requires a subscription-based account and more advanced GIS knowledge. Layers (shapefiles) created in QGIS, an open-source and free mapping software, can be exported to ArcGIS software, but an AGOL account and subscription are still required to implement it.
Once the external product is complete, it can be added to the existing story map. Depending on the product, a creator will choose either the map or embed option from the features list.
Though this route requires an Esri subscription and more knowledge of GIS, it offers more advanced ways to display data. The points created in these types of maps can also hold substantially larger amounts of information and data, making them more suitable for more detailed projects (Figure 6).
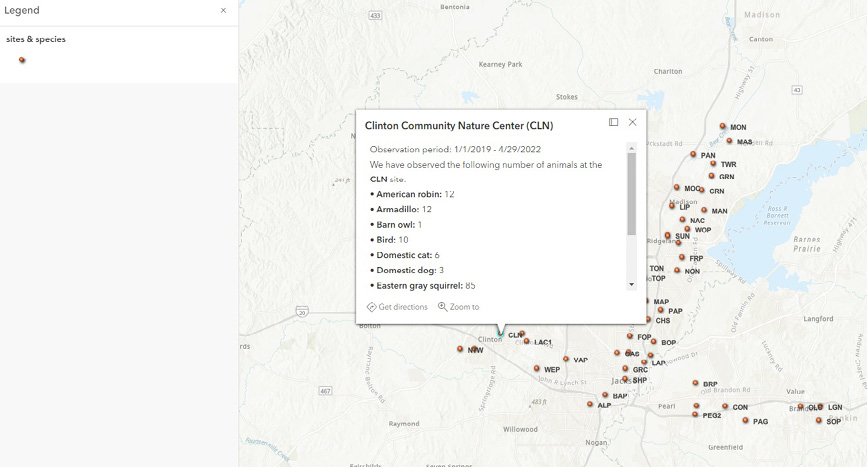
Typically, a database is needed to create these more advanced features. If a creator has a GIS department, please consult with the appropriate personnel. For teams that do not have access to a GIS department, it may be necessary to consult with a third-party provider and have them create a database. Esri offers several examples and guides to smart mapping, which may help partners better decide the map type and how to create it.
Additionally, features created from a database offer an option of automatic updates. For example, one story map may have a map created with a database showing the number of animals seen at multiple sites. Over time, this number will change. Instead of editing the story map directly, partners can simply update the existing database. This in turn will automatically update the information seen on the story map.
Regardless of whether a database is used, some degree of upkeep is necessary. A database will be slightly easier to maintain, as it can be updated automatically; however, dedicated time will be required to make regular updates.
Adding Images and Creating Image Galleries
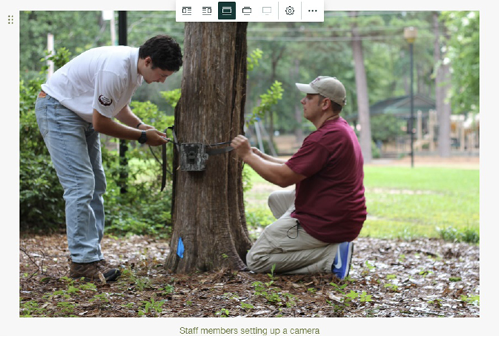
Another useful feature of StoryMaps is the ability to add multiple high-quality images in a variety of ways. Media, such as photos from camera traps, can help break up blocks of text and provide engaging visuals. To add static media, select the image option when creating a new content block.
Depending on the original size of the uploaded image, the size can be set to small, medium, or large. Some images near paragraph content blocks can also be anchored to the left or right side of the screen, changing the layout of the text. If this option is available, it will appear as float left or float right in the image toolbar pop-up (Figure 7).
Clicking on the gear icon in the toolbar will allow creators to add an attribution and alternative text for accessibility. Additionally, individual image uploads have space for a custom caption, located beneath the image. To edit the caption, click the text and make changes directly.
Tip: When creating a website, it’s important to consider how accessible it is. Alternative text for all images is typically required for a site to be Americans with Disabilities Act (ADA) compliant. Some teams that work within larger organizations may have in-house compliance rules, and we suggest contacting the relevant department for further details. For self-review, browser extensions such as Siteimprove can detect accessibility issues. Please note that some potential issues are inherent to the StoryMaps platform and cannot be changed, though Esri continues to make updates to improve accessibility on its platforms.
While we use images throughout our story map, our photo highlights section makes use of the image gallery feature. An image gallery allows the creator to upload up to 12 photos and arrange them as an array. Image galleries can be created like all other content blocks. Please note that this feature is only available with the subscription-based license.
One drawback of using this feature is the inability to add individual subtitles to each image. However, it’s possible to work around this limitation by using the attribution field to label images. To edit a photo’s attribution, hover the cursor over the desired image and click on the gear icon that appears. Do not click on the gear icon at the top of the page, since this edits the entire gallery and not the specific photo. Enter the desired caption into the attribution field. The caption will appear when you tap the encircled i button that should now appear in the top left of the picture.
Tip: When deciding which pictures to show, our team made the conscious decision to avoid showing images that could be seen as “confrontational.” This includes photos of large predator species or animals that may be seen as nuisances, such as bobcats and coyotes. Please take care when choosing which pictures to use and consider the effect they may have when presented to a general audience.
Images in the image galleries are automatically cropped. To change the cropping, open the option page by clicking on the gear icon again. The image preview section will show the image with a small gray circle in the middle, and how it appears on a desktop and smartphone. Click around the image to move the gray circle. This circle is the focal point. The cropping previews shown in the example desktop and smartphone window will change as the circle is moved. Exiting the editor will automatically save the crop (Figure 8).
Tip: To showcase many small images in a more condensed form (showing partner logos, etc.), it’s best to combine and upload them as a single image. For creators who don’t have access to image editing software, this can be done easily by pasting the images onto a blank Microsoft PowerPoint (PPT) slide and organizing them as desired. Once the images are organized, save the PPT slide as an image file (.png is preferred for web use) and add it to the story map as an image. Sites such as remove.bg can automatically remove the background from an image.
Creating Slideshows and Lateral Story Maps
If you are using the free version of StoryMaps and would like to display multiple images at once, the slideshow feature may be an alternate option to the image gallery. Slideshows allow users to click through multiple slides of text and media. However, it is possible to upload images and not add text. Creators can edit slides in a similar manner to editing Map Tour points.
Slideshows are also a good option for minimizing vertical scrolling, as they function by cycling through images horizontally. This feature may be a good option for partners who would like to add more detail about their existing Map Tour points without extending the vertical length of the overall story map.
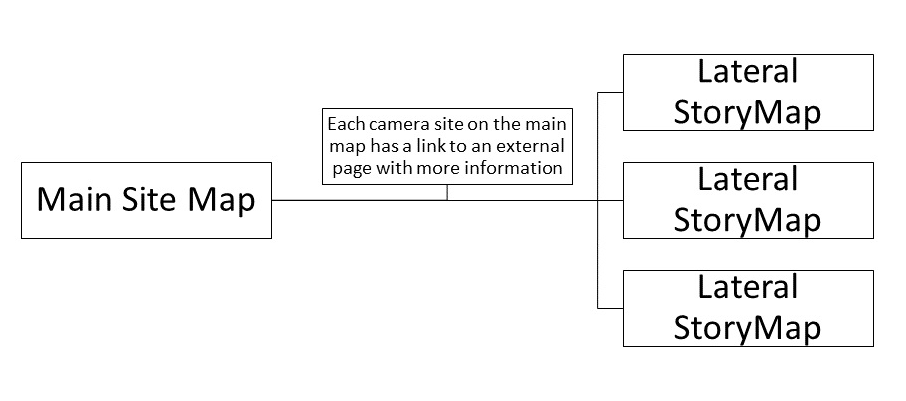
For example, if partners would like to show more information and photos related to a site, a slideshow can easily display that content and media. Partners who wish to
have this slideshow separate from their main story map site can create a new story map (referred to as a Lateral Story Map) and add a slideshow and an identifying header. Once this lateral story map is published, the header should produce a hyperlink that takes the user directly to the slideshow. This hyperlink can be found by hovering the cursor to the left of the header, where an encircled chain link icon should appear. Add this link to the main story map so users can be redirected (see Figure 9 on page 10).
Tip: Slideshows employ the “sidecar” feature, which allows more creative freedom in expressing media and data.
A lateral story map can be created for each site, or multiple slideshows can be added to the existing lateral story map. Consider what these sites might have in common, such as municipality or type of greenspace, and organize accordingly if you choose to combine sites on one lateral story map that is connected to the primary story map site.
To keep track of these lateral story maps, creators can use the collections feature. Creators can also make a few customizations when starting their lateral story map collections.
Displaying Data in Other Ways
StoryMaps offers many additional features not outlined in this guide. Depending on the individual program’s needs, these features might be more useful. The swipe feature, for example, is useful for comparing two maps or images.
Esri typically offers in-depth guides on how to use different features. We advise reviewing the recommended guides and browsing through other story maps that use these features. This story map provides a general overview of additional features.
Teams that have access to other Esri products and want to create more interactive sites or graphics may use ArcGIS Dashboards or the ArcGIS Experience Builder as an alternative to StoryMaps. Click here for more information about ArcGIS Dashboards. Click here to learn more about the Experience Builder.
Publishing, Reviewing Analytics, and Marketing
When finalizing a story map, partners may wish to include the names of the team members and other people who helped with the project. The contacts section of the story map can be used to list these key people. Text in the contacts section can also be hyperlinked, which allows partners to add links to external sites that would otherwise take up too much space on the main page.
Tip: There is no option to insert a line break for titles in the contacts section (i.e., text will only start a new line once the character limit is reached for line 1). To add information in separate lines, add spaces after the content in line 1 until it hits the end of the content block section. Any new text should automatically appear underneath the initial text in a new line.
Once the page is ready for publication, select the publish button at the top of the screen. A creator can now select the sharing level (who can access the map). Users with a paid version will also be able to use Group Sharing, which is useful when multiple people at an organization are editing the map.
The story details section shows the information (title, summary, and thumbnail image) that will appear when the story map is shared on social media or when it appears in search results. Partners can edit this information to their liking.
Teams using the licensed version of StoryMaps will be able to use Google and Adobe Analytics.
Partners who are not using the licensed version but would like to receive feedback can create a survey on Google Forms and link it somewhere on the story map. Google Forms can be a vital tool in helping partners learn the devices their primary audience is using and if the users are having trouble viewing any elements on the story map.
For advertising offline, partners may consider using a QR code. These codes can be added to greenspace signage or directly to camera cases, allowing those who find them to access project information directly. We recommend creating a dynamic QR code as opposed to a static code, as this will allow partners to update the URL if needed.
Conclusion
AGOL products offer a wide array of choices in displaying data for many purposes and audiences. Of these, StoryMaps continues to be the most accessible both cost-wise and experience-wise. While the trade-offs for using StoryMaps include more restricted design and layout choices, there are a variety of workarounds for creators willing to make compromises. Overall, our program’s story map has served extremely well as a general landing page for our project and helped us better inform others of the work we do.
Esri will continue to update its applications to improve capabilities and incorporate additional features. As such, the material in this guide may have some discrepancies.
An August 2023 update added the ability for users with an AGOL account to duplicate existing story maps. This functionality may be useful for creators who wish to make backup copies across multiple accounts.
Additionally, a more robust duplication process can be found here.
Partners who need to clone a story map (e.g., moving from a public account to an organizational account) or download a .zip file of their story map data can do so through Python. Click here for a detailed outline of the cloning process.
The information given here is for educational purposes only. References to commercial products, trade names, or suppliers are made with the understanding that no endorsement is implied and that no discrimination against other products or suppliers is intended.
Publication 3988
By K. Ann Smithson, Extension Associate I, Central Mississippi Research and Extension Center, John H. Cartwright, PhD, Assistant Extension Professor, Geosystems Research Institute, and Adam T. Rohnke, PhD, Assistant Extension Professor, Central Mississippi Research and Extension Center.

The Mississippi State University Extension Service is working to ensure all web content is accessible to all users. If you need assistance accessing any of our content, please email the webteam or call 662-325-2262.
Select Your County Office
Authors